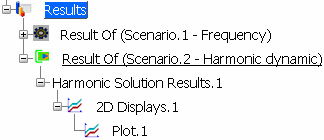
In the specification tree, right-click a dynamic
solution result, and select Generate 2D Display.
The 2D Display dialog box appears.
Optional: In the Name box, modify the name of the plot.
In the Format list, select the format
of the data you want to display (Real, Imaginary,
Magnitude, Phase (degrees)).
In the Result type list, select the
type of result you want to display: Displacement,
Velocity, or Acceleration.
You can select one, two, or three types of result. The plot contains one chart for each selected result type.
Select a node on the deformed mesh visualization.
Select the degrees of freedom you want to visualize (Tx, Ty, and Tz).
A curve is created for each degree of freedom that is selected.
Optional: Add
another node.
- Right-click a line and select Add.
- Select the degrees of freedom you want to take into account.
Optional: To remove data of a node from the plot, right-click the corresponding line, and select Remove.
Click OK.
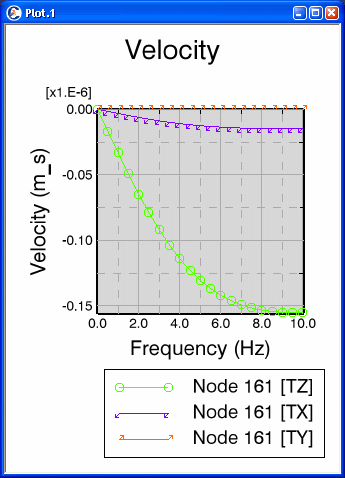
A window appears showing the plot and a feature is
created in the specification tree.


At any time you can display the plot again by
double-clicking the created feature. You can also modify the plot options, the chart options, the curve options, and the axis options.