Modifying Axis Options | |||||
|
| ||||
Modify the Axis Scale
You can modify the scale of XY plot axes.
Right-click anywhere in the plot window, and select Axis Options.
The Axis Options dialog box appears.
Select the X-axis or the Y-axis you want to modify in the X Axes list or in the Y Axes list.
Select the General tab.
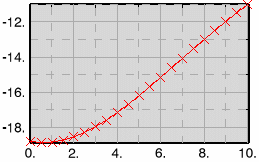
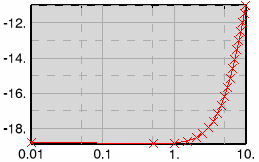
Select one of the following Scale options:
- Linear to display the axis in a linear progression.
- log to display the axis in a logarithmic progression.
- 10dB to display the axis in a 10 dB decibel-based scale.
- 20dB to display the axis in a 20 dB decibel-based scale.
X-axis with a linear scale:
X-axis with a logarithmic scale:
By default, CATIA computes the maximum axis value. To set a maximum limit for the selected axis, clear the Auto-compute check box of the Max option, and enter the desired maximum axis value.
By default, CATIA computes the minimum axis value. To set a minimum limit for the selected axis, clear the Auto-compute check box of the Min option, and enter the desired minimum axis value.
To preview the modifications, click Preview.
The dialog box remains open to continue modifying options if necessary.
To confirm the modifications and close the dialog box, click OK.
To cancel the modifications and close the dialog box, click Cancel.
![]()
Modify the Axis Title
You can modify the title of XY plot axes.
Right-click anywhere in the plot window, and select Axis Options.
The Axis Options dialog box appears.
Select the X-axis or the Y-axis you want to modify in the X Axes list or in the Y Axes list.
Select the General tab.
Modify the title properties of the selected axis.
A default title with units in parentheses is displayed for each axis.
- To change the axis title, select the Show title check box, select Custom, and enter the desired title.
The specified title appears in both the plot window and the Axis Options dialog box.
- To automatically add the units after the customized title, select the Append unit check box.
Important: The Append unit check box is available only if you selected Custom. - To modify the display properties of the title, select the Show title check box, and modify the color and the font of the title.
- To hide the axis title, clear the Show title check box.
- To change the axis title, select the Show title check box, select Custom, and enter the desired title.
To preview the modifications, click Preview.
The dialog box remains open to continue modifying options if necessary.
To confirm the modifications and close the dialog box, click OK.
To cancel the modifications and close the dialog box, click Cancel.
![]()
Modify the Axis Tick Marks
You can modify the tick marks of XY plot axes.
Right-click anywhere in the plot window, and select Axis Options.
The Axis Options dialog box appears.
Select the X-axis or the Y-axis you want to modify in the X Axes list or in the Y Axes list.
Select the Tick Marks tab.
Modify the display properties of the tick marks.
- To modify the appearance of the tick marks, select the Show tick marks check box; and modify the color, the thickness, and the line type.
- To modify the position of the tick marks on the axes, select one of the following in the Placement list: Inside, Outside, or Across.
- To modify the length of the tick marks, enter a value in the Length box.
- To hide the tick marks, clear the Show tick marks check box.
To modify the interval between major tick marks, select one of the following Frequency options:
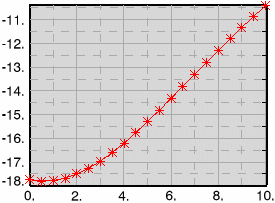
- Automatic to use a default incrementation.
- By increment to specify the increment between major tick marks; enter a value in the Tick increment box.
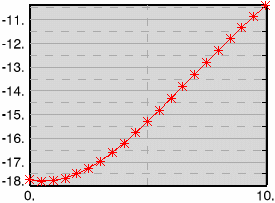
- By count to specify the total number of major tick marks between the minimum and maximum values along the axis. Use the Number of ticks arrows to increase or decrease the total number of major tick marks.
X-axis with automatic tick marks:
X-axis with two major tick marks:
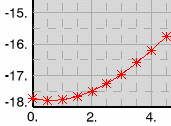
To modify the number of minor tick marks between two major tick marks, use the Ticks per increment arrows.
Example of an X-axis with three minor tick marks and a Y-axis with one minor tick mark:
To preview the modifications, click Preview.
The dialog box remains open to continue modifying options if necessary.
To confirm the modifications and close the dialog box, click OK.
To cancel the modifications and close the dialog box, click Cancel.
![]()
Modify the Axis Display
You can modify the display properties of XY plot axes.
Right-click anywhere in the plot window, and select Axis Options.
The Axis Options dialog box appears.
Select the X-axis or the Y-axis you want to modify in the X Axes list or in the Y Axes list.
Select the Axis tab.
To modify the appearance of the line that represents the selected axis, select the Show axis check box; and modify the color, the thickness, and the line type.
To modify the position of the line that represents the selected axis, select the Show axis check box, and select one of the following in the Placement list:
- Min edge to position the axis at the minimum edge of the chart. For X-axes, the minimum edge is the bottom of the chart. For Y-axes, the minimum edge is the left side of the chart.
- Max edge to position axes at the maximum edge of the chart. For X-axes, the maximum edge is the top of the chart. For Y-axes, the maximum edge is the right side of the chart.
- Min/Max edge to position the axis at both the minimum and maximum edges of the chart.
- Center to position the axis in the center of the chart.
To hide the line that represents the selected axis, clear the Show axis check box.
To preview the modifications, click Preview.
The dialog box remains open to continue modifying options if necessary.
To confirm the modifications and close the dialog box, click OK.
To cancel the modifications and close the dialog box, click Cancel.
![]()
Modify the Axis Labels
You can modify the labels of XY plot axes.
Right-click anywhere in the plot window, and select Axis Options.
The Axis Options dialog box appears.
Select the X-axis or the Y-axis you want to modify in the X Axes list or in the Y Axes list.
Select the Axis tab.
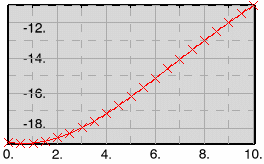
To modify the position of the labels, select the Show label check box, and select Outside or Inside in the Placement list.
In the following example, the labels of the X-axis are outside the chart and the labels of the Y-axis are inside the chart:
To modify the frequency of the labels in relation to the major tick marks, select the Show label check box, and use the Frequency arrows.
If you select a frequency of three, labels appear at every third major tick mark.
To modify the format of value labels, select the Show label check box, and select one of the following Format options:
- Automatic to express very large and very small values in scientific format, and all other values with no exponent and using the specified number of significant digits.
- Decimal to express values with no exponent and using the specified number of significant digits.
- Engineering to express values greater than or equal to 1000 and values less than or equal to 0.001 as a number ranging from 1 to 999 that is multiplied by 10 to the nth power (where n is a multiple of 3). All other values are expressed using the specified number of significant digits (for example, 46.8e+03 or 52.325e+09).
- Scientific to express all the values as a number between 1 and 10 that is multiplied by an appropriate power of 10 (for example, 1.55e+2 or 2.1e-5).
To modify the number of decimal places or significant digits in the labels, select the Show label check box, and use the Precision arrows.
To modify the display parameters of the labels, select the Show label check box, and modify the color and the font.
To hide the labels, clear the Show label check box.
X-axis with labels:

X-axis without labels:

To preview the modifications, click Preview.
The dialog box remains open to continue modifying options if necessary.
To confirm the modifications and close the dialog box, click OK.
To cancel the modifications and close the dialog box, click Cancel.