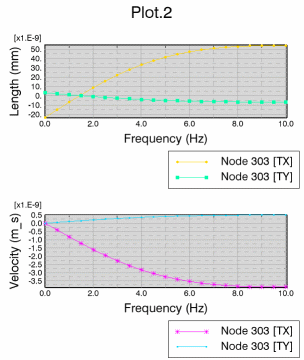
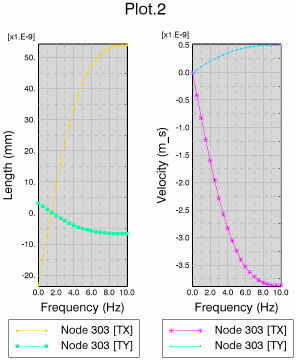
Right-click anywhere in the plot window, and select Plot Options.
The Plot Options dialog box appears.
Modify the background options.
- To
modify the color of the background fill, select the Show fill check box, and select a color in the color list.
- To remove the background color, clear the Show fill check box.
- To modify the border of the plot, select the Show border check box; and modify the color, the thickness, and the line type.
- To remove the border, clear the Show border check box.
Modify the chart layout options.
This option is useful when the plot contains several charts. - Select Tile horizontally to tile the charts horizontally.

- Select Tile vertically to tile the charts vertically.

Modify the title options.
- To hide the plot title, clear the Show title check box.
- To display a background, select the Show background check box, and select a color in the color list.
- To show a border, select the Show border check box; and select a color, the thickness, and the type of border.
To preview the modifications, click Preview.
The dialog box remains open to continue modifying options if necessary.
To confirm the modifications and close the dialog box, click OK.
To cancel the modifications and close the dialog box, click Cancel.
|