Comparing Machined Stock Part and Design Part | ||||||
|
| |||||
Select a Machining Operation in the Manufacturing Program, then select Tool Path Replay
 . See
Replaying the Tool Path and Simulating Material Removal in Video Mode for general information.
. See
Replaying the Tool Path and Simulating Material Removal in Video Mode for general information.In the Tool Path Replay dialog box, click Full Video
 to simulate the material removal by the Machining Operation.
The material removal video appears in a new window.
Start the comparison:
- Click
Analyze
 .
.
The Analysis dialog box appears.
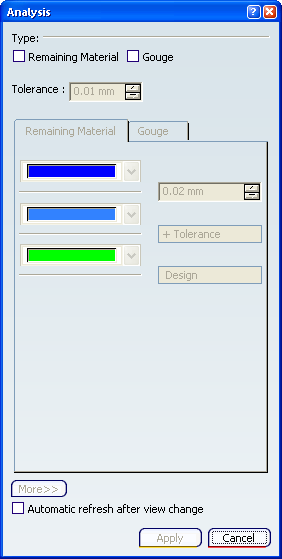
 By default,
the Remaining Material
tab displays three tolerance bands for analysis. More gives access to additional tolerance bands.
By default,
the Remaining Material
tab displays three tolerance bands for analysis. More gives access to additional tolerance bands.
- Go to the corresponding tab and
specify the tolerance bands for the comparison.
The remaining material and gouges are displayed as colored zones according to the specified tolerances.
The machined part is compared with the design part, based on the specified settings.
- Any point on the machined surface of the workpiece is considered to be part of a fault if the distance (deviation) to the design part surface is greater than the specified tolerance.
- The results of the comparison are reflected on the workpiece, based on the extent of severity of the fault and the customized color settings.
- Click
Analyze
Still in video mode, pick a point on the machined stock.
The Pick Point Information dialog box appears.
Notes:
- This information is available at every pick, provided that the point picked is a "machined area pick".
- Arc radius and Arc center are populated only if the picked point is on a circular entity.
- Deviation is displayed after you have compared the machined stock part and the target (design) part : the stock is rendered in a color-coded manner, depicting deviations from the design part. A subsequent pick displays the deviation value.
Important: When the design part is a surface entity with no thickness, the deviation on one of the sides is accurate and the deviation on the other side of the surface may be incorrect and may show infinity.