Simulating Material Removal in Photo Mode | |||||||
|
| ||||||
Select a Machining Operation in the Manufacturing Program, then select Tool Path Replay
 . See About NC Manufacturing Verification.
The Tool Path Replay dialog box appears for managing the replay and simulation.
The PPR Editor window switches to a window entitled Photo that shows the result of the material removal (referred to as photo below).
Analyze
 becomes available.
If needed, click Photo
 again to update the Manufacturing Program
data and the display.
again to update the Manufacturing Program
data and the display.Pick on the surface of the workpiece at any time to retrieve information.
A dialog box appears giving information about the pick point, such as:
- The Machining Operation used for removing material.
- The normal deviation between the workpiece and the design part.
- The X, Y, and Z coordinates of the pick point.
- The tool used for machining.
Zoom in a specific portion of the photo, right-click it and select Closeup in the contextual menu.
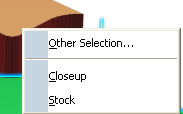
The close-up shows a more precise photo of the zoomed-in portion.
Click Analyze
to analyze the result of the simulation. This is done by comparing the machined part with the design part.
The Analysis dialog box appears.
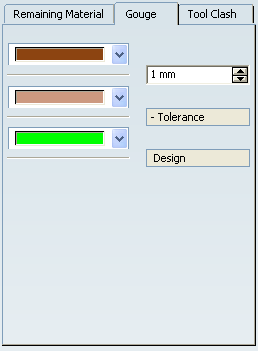
Select the desired fault types to be analyzed and specify the Tolerance for the comparison.
The tabs corresponding to the desired fault types become active as you select the check boxes.
- Remaining Material: analyzes areas
where the tool has left behind material on the workpiece.
- Gouge: analyzes areas where the tool
has removed excess material from the workpiece.
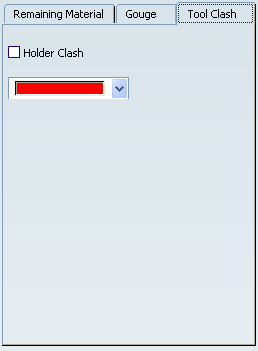
- Tool Clash: analyzes areas where the
tool collided with the workpiece during a rapid move.
Remaining material, tool clashes and gouges are displayed as colored zones according to the specified tolerances.
- Remaining Material: analyzes areas
where the tool has left behind material on the workpiece.
Click Apply.
The machined part is compared with the design part based on the specified settings.
- Any point on the machined surface of the workpiece is considered to be part of a fault if the normal distance (normal deviation) to the design part surface is greater than the specified tolerance.
- Results of the comparison are reflected on the workpiece, based on the extent of severity of the fault and the customized color settings.
- Detected faults are listed in the
Fault Selection list.
- Tool clashes appear at the top of the list, followed by gouges, then remaining material faults. The gouges and remaining material are sorted according to decreasing fault area.
- When you select a fault from the Fault Selection list, the corresponding region is indicated by a Fault Indicator bounding box on the workpiece.
Other detailed information about the selected fault is displayed.