About XY Plot | ||||
|
| |||
XY plot can be used to visualize, for example:
- Sensor results in the Structural Analysis workbench.
- Results of a dynamic solution in the Structural Analysis workbench.
- Probe results in the Kinematics Analysis workbench.
- Live plot results in the System Experiment workbench.
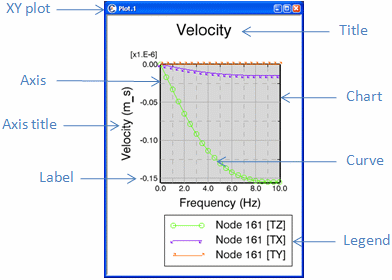
The following image describes the different elements of a plot:
The plot and each part of the plot can be modified:
If several curves are displayed in the same chart with different magnitudes and different axes, when you pass the cursor over a particular curve, the curve and its associated axes are highlighted.
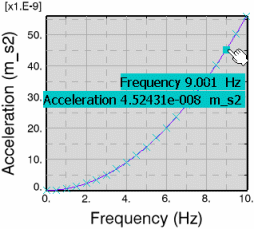
When you pass your cursor over a curve point, the corresponding values are displayed: