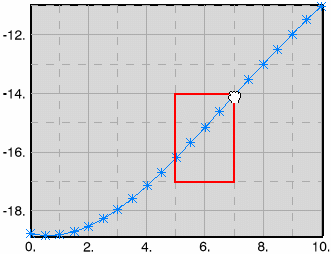
Position the cursor at one corner of the area to be enlarged, click and drag the cursor to the opposite corner, and release
the cursor.

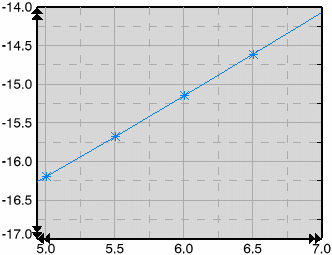
The curve view is enlarged and the axis values are updated to match the data you select.

You can pan the view after you have zoomed in to a region.
To
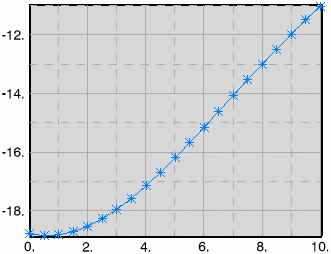
reframe to the entire display, right-click anywhere in the chart area, and select Fit All In.
The plot is reframed.

|