Production System Simulation Options | ||||||||
|
| |||||||
When you open the Production System Simulation Workbench you can see the Simulation Option ![]() in right side of the authoring window. Click this icon to get the Production System Simulation Options dialog box.
in right side of the authoring window. Click this icon to get the Production System Simulation Options dialog box.
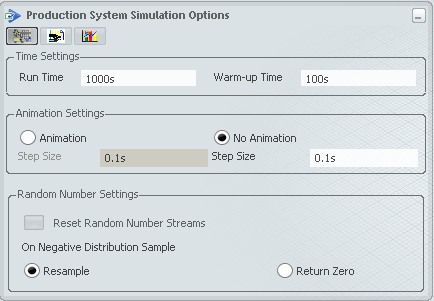
Simulation Options

![]() By default,
the Simulation Options tab is opened.
By default,
the Simulation Options tab is opened.
- Run Time
- Specifies the allotted time.
 By default,
the Run Time is 100s.
 - Warm-up Time
- Specifies the preparation time.
 By default,
the Warm-up Time is 1000s.
 - Animation Step Size
- Specifies the animation step size.
 By default,
this check box is not selected and Animation Step Size is 0.1s.
 - No Animation Step Size
- Specifies the no animation step size.
 By default,
this check box is selected and Animation Step Size is 0.1s.
 - Reset Random Number Streams on Negative Distribution Sample
- Select this check box to reset random number streams on negative distribution sample.
 By default,
this check box is not selected.
 - Resample
- Select this check box to resample the streams.
 By default,
this check box is selected.
 - Return Zero
- Select this check box to returns to zero.
 By default,
this check box is not selected.
![]()
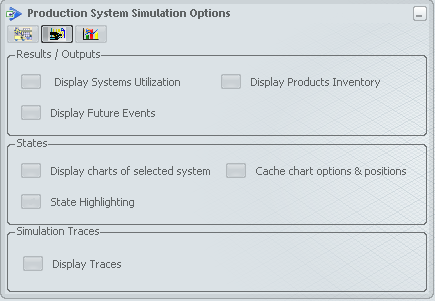
Monitoring Options

- Display Systems utilization
- Select this check box to display System Utilization tab
 in System Performance Monitor dialog box.
 By default,
this check box is not selected.
 - Display Products inventory
- Select this check box to display Product Inventory tab
 in System Performance Monitor dialog box.
 By default,
this check box is not selected.
 - Display Future Events
- Select this check box to display Debug Simulation Events tab
 in System Performance Monitor dialog box.
  By default,
this check box is not selected.
 - Display Charts of selected system
- Select this check box to visualize system specific charts along with dynamic updates.
After selecting this check box, by default the Current State command is launched. You can directly select the system for which you wants to see the current state during simulation. See Viewing Simulation States and Results
 By default,
this check box is not selected.
 - Cache chart options and positions
- Select this check box to position some system specific charts with different views at different locations on authoring window. When you restart the simulation then all the opened system specific charts automatically gets opened at their respective places in the same view which you kept.
 By default,
this check box is not selected.
 - State Highlighting
- Select this check box to preview the tile updates.
 By default,
this check box is not selected.
 - Display Traces
- Select this check box to display Debug Simulation Events tab
 in System Performance Monitor dialog box.
 By default,
this check box is not selected.
![]()
Analysis Options

- Track Objective
- Select this check box to display Track Objective tab in System Performance Monitor dialog box.
 By default,
this check box is not selected.
 - Detect Bottlenecks
- Select this check box to display Bottleneck tab in System Performance Monitor dialog box and to start the bottleneck detection analysis.
 By default,
this check box is not selected.