Viewing Simulation States and Results | ||||||
|
| |||||
View System Utilization and Product Inventory Charts
You can visualize the system utilization and product inventory charts along with dynamic updates during the simulation.
Select Display Systems Utilization and Display Products Inventory checkboxes in Monitoring Options tab
 of Production System Simulation Options dialog box.
The Systems Utilization and Products Inventory tab
 appears in the System Performance Monitor dialog box.
Select a system and click Play
 in PLM Compass to start simulation.
The System Performance Monitor
 appears.
Click System Performance Monitor
after or during simulation.The System Performance Monitor dialog box appears.
Click System Utilization
 tab in System Performance Monitor dialog box.
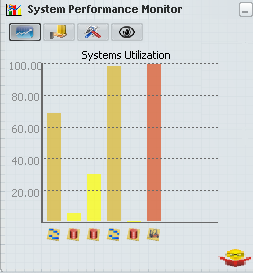
System utilization is available only for General
 , Transfer
  , and Buffer
 systems. This data is represented
using vertical bar chart, with unique color of each type of
system.
systems. This data is represented
using vertical bar chart, with unique color of each type of
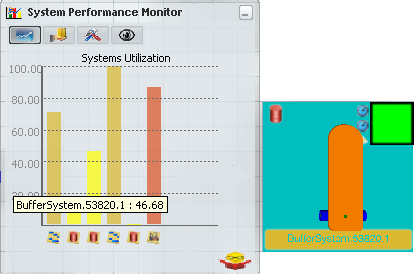
system.Place pointer over the system utilization bar chart.
The corresponding system name and utilization value is displayed as tool tip. Select any bar on the bar chart and the corresponding system is highlighted in the Live System Editor.
Click Product Inventory
 tab.
tab.The dialog box showing products inventory appears.
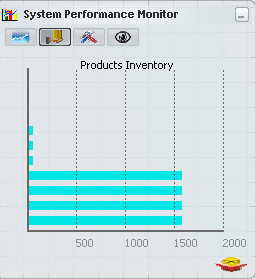
This tab provides the number of products that are currently in use during simulation. This data is represented with horizontal bar chart.
Place pointer over the product inventory bar chart.
The corresponding product name and count value is displayed as tool tip. Select any bar on the bar chart and the corresponding product representation is highlighted in the Live System Editor.
Calculate the products inventory as:
Products Inventory = (NUMBER_INITIAL + NUMBER_PRODUCED + NUMBER_ARRIVED + NUMBER_ACCEPTED) - (NUMBER_ROUTED + NUMBER_CONSUMED + NUMBER_DISPATCHED + NUMBER_ASSEMBLED)
Click
 to view the HTML report.

![]()
View System Specific Charts
You can visualize system specific charts along with dynamic updates. You can also position the system specific charts with different views at different locations on screen, when the simulation is restarted then all the opened system specific charts automatically gets opened at their respective places in the same view which was kept.
Select Display Charts of selected system and Cache chart options and positions checkboxes in the Monitoring Options tab
of the Production System Simulation Options dialog box.Select a system in Live System Editor.
A dialog box pops up with two tabs and each tab contains two expandable buttons.

Click Current State
tab.Two charts get displayed; one with Product & Requests and other with Operations frame.
- The Product & Requests chart is shown as a grouped bar chart for General, Transfer, and Buffer systems.
- The operations are shown as stacking vertical bar chart with each stack representing the operation time.
- Operation time can be calculated as "Processing Time + Repair Time". Operation time is shown as percentage values in stacked bar.
Click Statistics
tab.Two charts get displayed one with Products and other with State Times frame. The Products chart shows then number of products on the resource in a vertical bar chart. The State Times chart show a pie chart representing the state times of the resource.

State time charts are not shown for Source and Sink systems. The grouped bar chart in Product tab is shown only for General and Transfer systems. You can see only a single grouped bar chart for Source, Buffer, and Sink systems.
The following table shows the summary of charts available on all systems.
Systems Current State Tab Statistics Tab Product & Requests Operations Products State Times General System Grouped Bar Chart Stacked Bar Chart Grouped Bar Chart Pie Chart Transfer System Grouped Bar Chart Stacked Bar Chart Grouped Bar Chart Pie Chart Buffer System Grouped Bar Chart Stacked Bar Chart Bar Chart Pie Chart Source System Bar Chart Stacked Bar Chart Bar Chart None Sink System Bar Chart Stacked Bar Chart Bar Chart None Click
to launch HTML report.


![]()
View Saved/Generated Simulation Results
You can visualize the saved/generated results of simulation scenarios in the form of charts.
Create/load a scenario and simulate it using Simulate and Generate Results
 command.
Switch to Live System Editor and click Generate and View Results of Scenario
 in Edit Scenario sub-toolbar.
Select an empty grid in Live System Editor.
A Global Statistics Report appears with System
, Product Inventory , and Operation  tabs.
tabs.When clicked on the empty grid in Live System Editor, saved results (if any) of the selected scenario are displayed in the form of charts.
Results does not get re-generated if the simulation parameters are not modified. After modifying the scenario parameters, clicking on Simulate and Generate Results command invalidate the old results and re-generates the new results.
Note: Run selection option
 are available for multi-run simulation.
Click System
tab.This tab provides the system utilization of General, Buffer, and Transfer systems in the simulation scenario. System utilization in represented in the form of a bar chart.
- Place pointer over the bar chart.

The corresponding system name is displayed as tool tip.
- Place pointer over the bar chart.
Click Product Inventory
tab.This tab provides an overview of the all products which have entered, exited, and produced etc. This information is represented with a vertical bar chart.
- Place pointer over the bar chart.

The corresponding product name is displayed as tool tip. Select any bar on the bar chart and the corresponding product is highlighted in the Live System Editor. In the above image, the highlighted product is marked red.
- Place pointer over the bar chart.
To view System Specific Charts.
The steps below describes you how to view system specific charts for General systems. The same steps can be followed to view system specific charts for Transfer and Buffer systems.
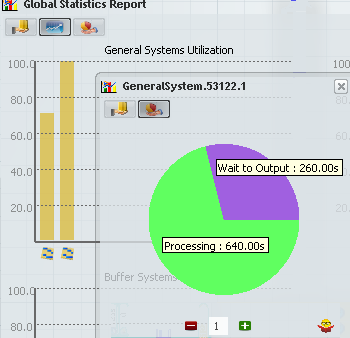
- Click bar chart in General system Utilization tab.
The General system gets highlighted in the Live System Editor and the chart showing General system utilization and operation comes in view.

- Click Product Inventory tab to get products graph as a vertical bar chart.
- Click Operations to get state times of the system in pie chart.
- Click to launch the HTML report.
- Click bar chart in General system Utilization tab.
Click Operations
tab.This tab provides information about General Operations and Repair Operations. Both these graphs are shown as vertical stacking bar.

Click
to launch HTML report.


