Detecting Bottleneck Charts | ||
| ||
Select Detect Bottlenecks check box in the Analysis Options tab
 of the Production System Simulation Options dialog box.
See Analysis Options
Select a system and click Play
 in the PLM Compass to start simulation.
The System Performance Monitor
appears.Click System Performance Monitor
after or during simulation.The System Performance Monitor dialog box appears.
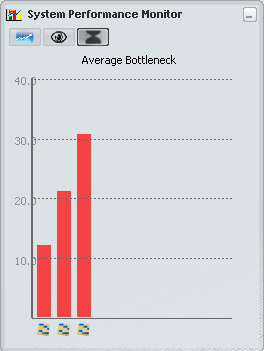
Click Bottleneck Viewer
 tab in the System Performance Monitor dialog box.
The Average Bottleneck chart appears.
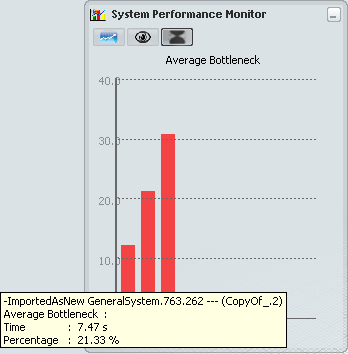
Place pointer over the bar chart in the Average Bottleneck chart.
The system name, time, and percentage of time with respect to simulation time is shown as tool tip.