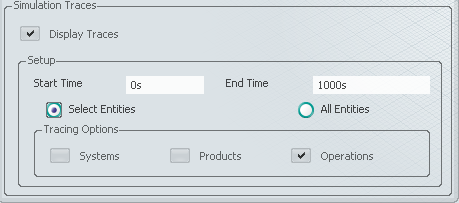
Select Display Traces check box in the Monitoring Options tab  of Production System Simulation Options dialog box.
See Monitoring Options
The Debug Simulation Events tab  appears in the System Performance Monitor dialog box.
Specify the simulation Start Time and End Time.
Start time of simulation trace must always be larger than or equal to the current simulation time. End time of
the simulation trace must be larger than the start time of simulation trace.
Select Select Entities check box and further select Systems/Product/Operations check box and then select systems/products/operations from the Live System Editor or PPR Context.
The selected systems/products/operations get added to the filter and only the
simulation traces of these entities are displayed. During the systems/products/operations selection, the selected entities
are highlighted in the Live System Editor and PPR Context.
Select All Entities check box to display the simulation traces of all the operations which are executed on the systems/products.
In this case, all simulation traces are displayed and no filter is applied.
Select a system and click Play  in PLM Compass to start simulation.
The System Performance Monitor  appears.
Click System Performance Monitor after or during simulation.
The System Performance Monitor dialog box appears.
Click Debug Simulation Events tab in the System Performance Monitor dialog box.

Click  to show/hide the simulation traces.
