Reviewing Scenario Results | ||||||||||
|
| |||||||||
Click View Scenario Results
 .
.
Select the kinematics scenario whose probes, excitations, and engineering connections values you want to review.
Note: Alternatively you can select a result of scenario first, and select View Results of Scenario .
The View Results of scenario dialog box appears:
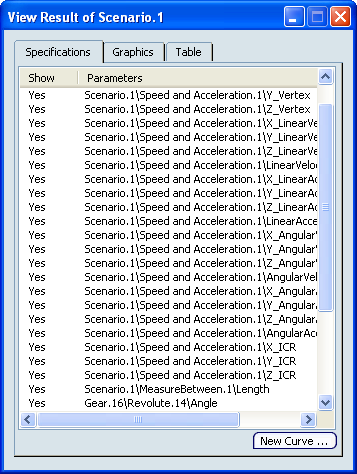
The View Result of Scenario dialog box includes three tabs:- Specifications: Allows you to filter the parameters to review. The filtered parameters are reflected in the contents of the Graphics and the Table tabs.
- New Curve: Allows you to create a new parameter that represents some existing parameter versus another existing parameter (other than time).
- Graphics: Displays an XY plot view of the results—a two-dimensional graph of a variable versus time or another variable.
- Table: Provides results under a tabular format.
See About View Scenario Results for more information.
- Specifications: Allows you to filter the parameters to review. The filtered parameters are reflected in the contents of the Graphics and the Table tabs.
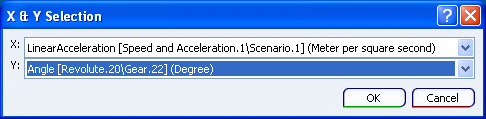
To create a new parameter that does not involve time versus another existing parameter:
- Click New Curve.
The XY Selection dialog box appears.
- Click New Curve.
To display the results in an XY plot, click the Graphics tab.
The XY plot appears in the window, and a curve is created for each probe and each excitation that is selected in the scenario.

To customize the XY plot view, see Working with Plots.
To send kinematics scenario results to an Excel file:
- In the Table tab, click Export....

- In the dialog box that appears, enter a name for the Excel file in the Name box.
- Optional: Modify the name in the Document Name box.
- Click Finish.
The Excel file is created, and a Documents folder is created in the specification tree under the Results category.
If you propagate the simulation, the kinematics scenario results you generated are automatically propagated in the database as attached documents. See Retrieving Results of Scenario in the Database.
- In the Table tab, click Export....

