About Reviewing Scenario Results | ||||
|
| |||
If you include probes and excitations with your kinematics simulation scenario, the results are stored in a tabular format with the simulation results.
The View Result of scenario dialog box allows you to activate a subset of result parameters for a kinematics scenario. You can plot them, as well as export the results stored in tabular format to an Excel file. The View Result of Scenario also lets you create customized curves by plotting one probe or an excitation value versus another. The standard two-dimensional graph plots the parameter values in Y-direction versus time in the X-direction.
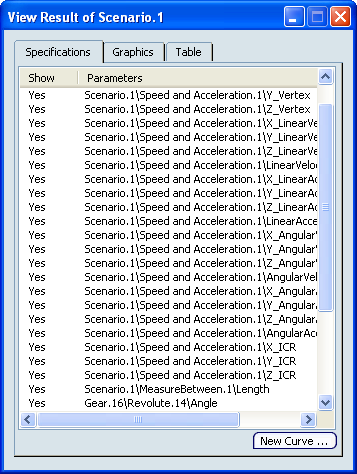
The View Result of Scenario dialog box includes three tabs:
- Specifications: Lists the probes and excitations included in the kinematics scenario, as well as the parameters for engineering connections (except user defined engineering connections) defined with controlled constraints but not used as excitations. All parameters appear in the table. You can control whether or not they appear in the Graphics or Table by toggling the first column. By default, all parameters are toggled on (Yes).
- Graphics: Dispays an XY plot view of the scenario results.
- Table: Lists the value of each probe, excitation and controlled constraint in the scenario at each time increment in the simulation.