Displaying Contour and Vector Plots

You can display the results of a simulation on your model using contour plots and vector plots.

  • For result values that consist of only a magnitude (scalars), a contour plot applies color coding to your model to indicate the magnitude of the result in different regions of the model.
  • For result values that consist of a magnitude and a direction (vectors), a vector plot uses arrows to indicate the direction of the result in different regions of the model. Color coding is applied to the arrows to indicate the magnitude of the result at each arrow.

A legend associates each color with a particular value for the selected result type.


Before you begin: A simulation must be complete before you can display result plots.
Related Topics
Modifying Plot Display Options
Probing Result Values
DesignSight Results
Executing Simulations from the DesignSight Workbench
  1. If it is not selected already, click View Results in the Simulation Panel.

  2. In the Results drop-down box, select the result you want to view.

    The available results depend on the simulation method you are using.

    The plot of your model is updated according to the selected result.

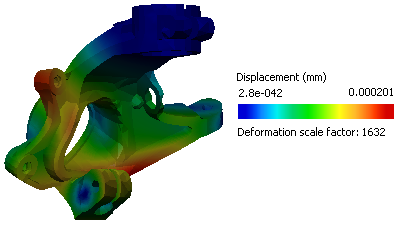
  3. If the simulation involves physical deformation in the model, click Play in the compass to view an animated plot of the model deforming.

  4. To see precise values for the selected result at various points, move the pointer over the model. Clicking on the model displays additional tools in the postprocessing balloon; see Probes and Display Groups for more information.