Modifying Plot Display Options | |||||
|
| ||||
Double-click the plot legend.
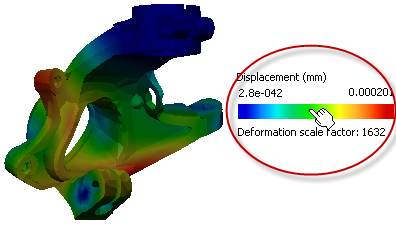
The Plot Options dialog box appears.
To set limits on the maximum and minimum values in the color coding legend, enter a value in the Max and Min boxes.
The color coding of the contour or vector plot changes according to the new maximum and minimum values.
The imposed limits are always displayed at the bottom of the color coding legend, and true result value ranges are displayed at the top of the legend. A marker appears on the legend depending on whether the imposed maximimum or minimum limits are greater or less than the true maximum or minimum values:
- If the imposed maximum limit is less than the true maximum value, the imposed maximum limit is indicated by a marker at the bottom of the color coding legend; a similar marker is used if the imposed minimum limit is greater than the true minimum value:
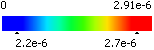
In this example, all values greater than the imposed maximum are colored in red; all values less than the imposed minimum are colored in blue. - If the imposed maximum limit is greater than the true maximum value, the true maximum value is indicated by a marker on the top of the color coding legend; a similar marker is used if the imposed minimum limit is less than the true minimum value:
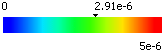
- If the imposed maximum limit is less than the true maximum value, the imposed maximum limit is indicated by a marker at the bottom of the color coding legend; a similar marker is used if the imposed minimum limit is greater than the true minimum value:
To modify the number of colors used in the legend, enter a value in the Intervals box.
Example of a legend with ten intervals:

Example of a legend with three intervals:

To modify the distribution of values across the color range, select the Smooth colors check box.
Smoothed colors:
Nonsmoothed colors:

To reverse the color order in the legend, select the Reverse colors check box.
By default, the colors vary from blue (for the minimum value) to red (for the maximum value):
Example of reversed colors:

To restore the Max, Min, or Scale factor values to their original defaults, click
 next to the appropriate box.