Probing Result Values | ||||||
|
| |||||
If necessary, select
 in the first column of the balloon to enter probe mode.
To display maximum or minimum values for the current result in the model, select an option in the second column of the balloon:
 Display only the maximum values.
 Do not display maximum or minimum values.
 Display both maximum and minimum values.
 Display only the minimum values.
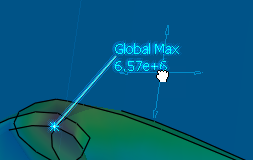
The requested maximum and minimum values appear on the model with lines indicating the location of the value on the model. An asterisk (*) next to the value label indicates that the maximum or minimum value is based on only the visible portion of the model (see Changing the Model Visibility).
Note: Multiple maximum or minimum values may be displayed:
- The maximum values represent the upper 0.1% of the overall range of available results values.
- The minimum values represent the lower 0.01% of the overall range of available results values.
To move a label associated with maximum or minimum values, click the label and drag it to the desired location.