Accessing the Gantt Chart

Gantt charts enable you to see where each sequence occurs in relation to other sequences in terms of time. Use the Gantt chart to create a sequence, add activities to sequence and arrange activities in a sequence, as well as edit the duration of sequences and their beginning and ending times. You can work with sequence times either numerically and graphically. You can also add activities and tracks from the Gantt chart, and also use track operators from the Gantt chart.


Before you begin:

Open PPR context data, select Assembly Path Definition, and open Live Simulaiton.

  1. Click Show Gantt in Live Simulation .

    The Assembly Sequence Gantt chart appears.

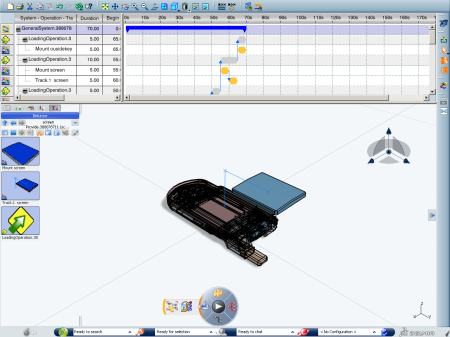
  2. Right-click on the nodes in the Gantt chart to create tracks (including kinematic tracks), apply track operators to tracks, or perform other actions for which the Gantt chart is uniquely suited, such as modifying the time or sequence of tracks.

  3. Click Hide Gantt when you no longer want the Assembly Sequence Gantt to appear.