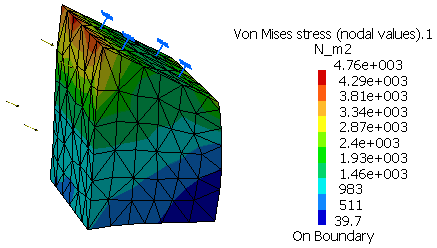
In the Pre-defined Image toolbar,
click Von Mises Stress
 .
.
The von Mises stress image and its associated
color map are
displayed, and
Von Mises stress (nodal values).1 appears in the specification
tree under the selected solution result.


By default, the von Mises stress distribution on the part is
visualized in iso-value mode along with a color map. You can change
this visualization by
editing the image.