Graphic Properties Wizard | ||
| ||
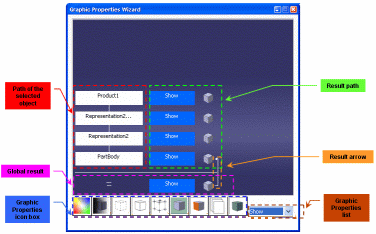
This wizard appears when you click Graphic Properties Wizard ![]() in the Graphic Properties toolbar and it is made up of the following elements:
in the Graphic Properties toolbar and it is made up of the following elements:
- Path of the selected object displays the hierarchy tree of the selected object. You cannot select multiple objects therefore one path only is displayed.
- Result path displays the "result" of the graphic property you have selected in the list. If no graphic property has been defined for the selected object, Not Defined is displayed.
- Global result shows the global result for the path displayed above. This result is a cumulative effect of different graphical properties set on the object and its parents. This result corresponds to graphical properties of the selected object.
- Result arrow indicates which object the global result comes from.
- Graphic Properties icon box lets you select the graphic property on which you want information by clicking the corresponding icon. An alternate method is to use the Graphic Properties list.
- Graphic Properties list lets you select the graphic property on which you want information by selecting the desired property in the list. An alternate method is to use the Graphic Properties toolbar.
Graphic Properties icon box
The Graphic Properties icon box lets you use the following icons:

- Color

Indicates the color of each object in the path (equivalent to Color in the list) in the box displayed to the right. In the example below, the color of PartBody displayed in the global result area is "green":

- Opacity

Displays the opacity value applied to each item in the path (equivalent to Opacity in the list). The background color also reflects the opacity. The lighter the color, the less opaque the object:


- Linetype

Displays the linetype applied to edges (equivalent to LineType in the list). The boundary of the box displayed to the right of each item is drawn according to the associated type as shown by the following two examples:


- Thickness

Displays the line thickness (equivalent to Thickness in the list). When a thickness has been defined, a line is displayed next to the object along with the corresponding value in millimeters. The higher the value, the thicker the line:


- Symbol

Displays the symbol used to represent the object, if any (equivalent to Symbol in the list):


- Show

Indicates whether an object is displayed in Show or No Show mode (equivalent to Show in the list). These two different modes are identified by two different background colors and two different pictures:


- Pick

Indicates whether an object can be selected or not (equivalent to Pick in the list). These two different modes are identified by two different background colors and two different pictures:


- Layer

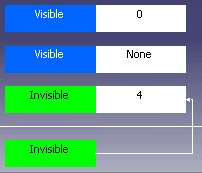
Indicates which objects are visible or invisible (equivalent to Layer in the list). To assign objects to layers, see Assigning Objects to Layers and to learn how to make objects visible or invisible, see Using Visualization Filters. The layer to which each object is assigned is identified by a different background color and the layer number is displayed opposite the visibility information:

In the picture above, no layer number is indicated for the global result.
- Low Intensity

Indicates whether a low-intensity color has been applied to an object or not (equivalent to Low Intensity in the list). The default low-intensity color is "dark green" but you can change it in the Visualization tab. When a low-intensity color has been applied, it is displayed in background. Otherwise, there is no background color and the state is "Normal":


