Using Visualization Filters | |||
| |||
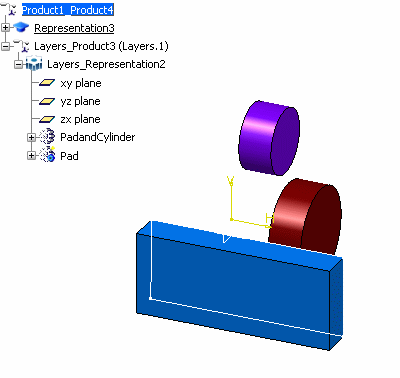
Open a document with geometrical data.
In this scenario, we use a product with two part bodies containing at least one pad each:
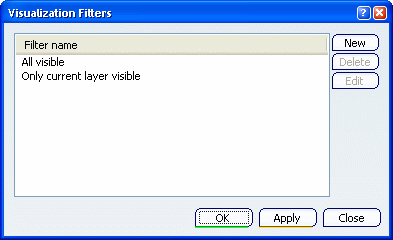
The default current filter All visible is applied automatically: it lets you see all the contents of the document. This filter cannot be deleted.
In the Visualization Filters dialog box, click New.
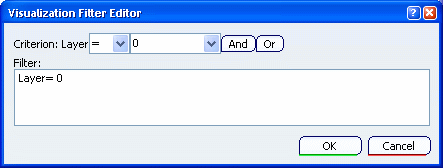
- Criterion: lists the operators you can use: =, !=, >, <, <= and >=; The default operator is "=".
- the list to the right displays the named layers (you can type any layer number between 0 and 999).
- And and Or provide you with the
corresponding logical functions for combining layers:
- And lets you add criteria (for instance, Layer>0 & Layer<10 means that objects displayed in layers 1 to 9 will be displayed).
- Or lets you filter according to at least one of the criteria you define (for instance, Layer=0 + Layer=1 means that objects contained in layer 0, or in layer 1 will be displayed.
- The Filter box specifies the final filter syntax.
Tip: When pointing to a filter name, a tooltip indicates where the filter definition location is stored. The storage location cannot be modified and is set as explained below: - For parts, it is stored in the representation. If no definition is stored in the representation, the part objects use the definition stored in the CATSettings directory. The visualization filters cannot be administered because it is not relevant for the administrator (who would only be able to lock the instance of the currently edited representation).
- For drawings, it is stored in the representation. The visualization filters cannot be administered (same explanation as above).
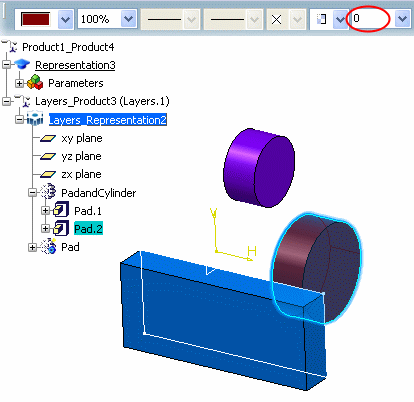
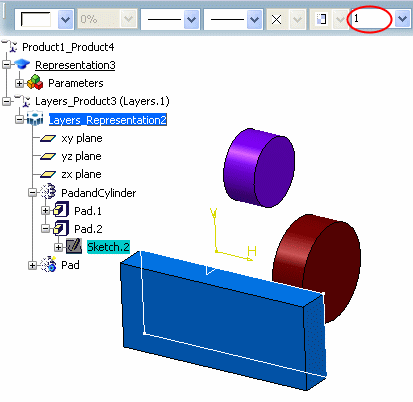
Select Pad.2 in the tree, click the arrow on the Layer list and check that the Layer list looks like this:
Select Sketch.2 in the tree, click inside the Layer list, then type 1.
Sketch.2 is assigned to Layer 1. The Layer list now looks like this:
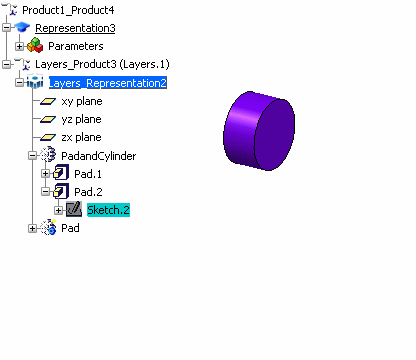
Select Filter001 in the Visualization Filters dialog box and click Apply.
The objects under PadandCylinder are no longer displayed, and the filter remains active:
Why are these objects no longer displayed?
All the features below the root object in the tree are considered to be on layer 0 if applying the visualization filter makes the objects invisible. This remains the case even if you assign the objects to layers other than layer 0.
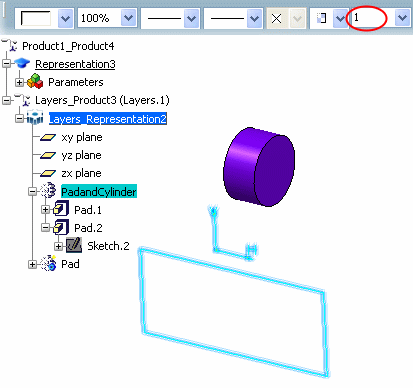
This time, select the root object PadandCylinder in the tree, click the Layer list, then type 1 to assign it to layer 1.
The filter is still active, but this time the object Sketch.2 becomes visible:
Why is only the Sketch object displayed?
This time applying the visualization filter has the effect of making objects visible, so the Sketch object becomes visible.