About the Manufacturing System Gantt Chart | ||||
|
| |||
How to Open the Manufacturing System Gantt
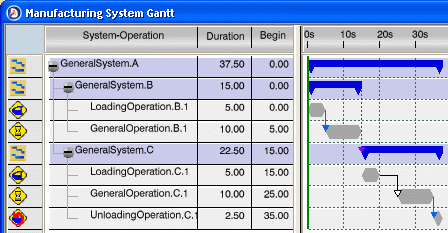
The Manufacturing System Gantt chart is opened by selecting Manufacturing System Gantt in the System Tools toolbar, then selecting either the root system or a child system under the root system.
Multi-selection is not available. Only one system and its children are displayed in the Manufacturing System Gantt.
If a child system is selected:
- the constraints between operations are taken into account even if they are not displayed in the Gantt scope
- the Product flow is taken into account even if it is outside what is displayed in the Gantt scope.
![]()
Columns in the Manufacturing System Gantt
The columns of the Manufacturing System Gantt chart display information about systems, operations, parts, fasteners and resources. Any of the columns (except System-Operation) can be hidden/shown by right-clicking in the header area and deselecting /selecting any of the column check box options.
The columns in this Gantt chart are as follows:
- System-Operation: Displays a tree view of the Systems and operations.
- Duration: Difference between the start and end time.
- Begin Time: Start time of an operation.
- End Time: End time of an operation.
- Utilization: Percentage of time for which a resource is utilized.
- Associated Parts: Instance names of the assigned parts of an operation. Parts may be displayed as a list with a separator (,).
- Type of Time: Estimated, simulated, or analyzed time of an operation.
- Number of Fasteners: Displays the number of assigned fasteners for operation and resources. The first number on the resource indicates the number of fasteners assigned directly to this resources behavior. The number in brackets is the sum of the fasteners assigned to the resources direct behavior and all fasteners assigned to all child behaviors.
- Executing Resource: The working resource assigned to the operation.
- Localized Resource: The organizational resource assigned to the operation.
- Used Resource(s): The non-working resources assigned to the operation.
- Resource used for positioning: The resource used for parts positioning for a given operation.
To hide/show any of the columns (except System-Operation), right-click in the column header area and deselect/select any of the column check box options.
To change the column size, place your cursor over the edge of the column (the cursor changes to arrow shape). Move the cursor left or right to change the column size.
To move a column, select the column (the cursor changes to hand shape). Move the selected column to left or right as required.
Note that you can use the Customize Column(s) contextual command to customize the columns of the Gantt chart with operation, system and resource attributes or any new customized attributes.
![]()
Flow View / System View
A Flow view and a System view are available in Manufacturing System Gantt chart.
- Flow View: This view displays the flow between systems. It takes into account the full product flow and time constraints between operations.
- System View: This view displays every system instance at zero begin time. All systems are seen in parallel. This view does not take into account product flow between systems. However, the time constraints between operations are displayed and taken into account.
To switch from one view to the other, right-click the root object of the Gantt chart and select either Flow View or System View in the contextual menu. 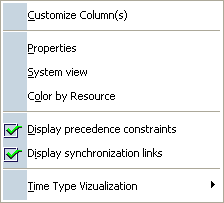
The Flow View / System View is managed for all open Manufacturing System Gantt charts.
![]()
How to Create Operations in the Manufacturing System Gantt
A operation can be created under a system or under another operation in the Manufacturing System Gantt chart.
This is done as follows:
- Click the desired operation command in the Operation Authoring toolbar.
- Select a System in the Gantt chart or any of its operations (father of the new operation).
- Enter its name in the pop-up that appears.
The new operation is then displayed under the System after its last operation (if a System was selected) or under the operation (if an operation was selected).
![]()
How to Create Constraints between Operations by Drag and Drop
Constraints between operations can be created in the Manufacturing System Gantt chart either using toolbar commands or by dragging and dropping operations.
To create constraints between operations using the commands of the Operation Authoring toolbar, see Creating Time Constraint Links between Operations.
Alternatively, you can create constraints between operations by dragging and dropping an operation to another operation. This creates a precedence constraint between the two operations.
Dragging and dropping an operation to another operation and pressing the Ctrl button opens a balloon toolbar for defining the desired constraint.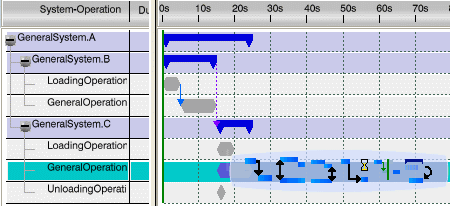
The commands in the balloon toolbar are as follows:
- Create Precedence Link
 to create a precedence constraint between the two operations.
 - Create Start-Start Link
 to create a start-start synchronization link between the two operations. Both operations will start at the same time.
 - Create End-End Link
 to create an end-end synchronization link between the two operations. Both operations will end at the same time.
 - Create End-Start Link
 to create an end-start synchronization link between the two operations. You can set a delay between the end of one operation and the start of the other.
 - Create Previous Cycle Link
 to create a link between two operations in different cycles.
 - Move Operation
 to move the operation under another operation. The dragged operation becomes the child of the other operation.
![]()
Operation Colors
In the Manufacturing System Gantt chart, colors can be assigned to operations that belong as the same system or that are assigned to the same resource.
This is done by means of the Color in Gantt View contextual command and the two color modes, which are also available in the contextual menu: Color by System and Color by Resource.
The selected color is applied to all the operations of the Gantt. The behavior is the same whether you select the root System or root Resource, or a child System or a child Resource node.
![]()
Time Types for Operations in the Manufacturing System Gantt
The Manufacturing System Gantt chart works with the estimated, simulated, or analyzed times of an operation. This is displayed in the Type of Time column of the chart.
- Estimated times are entered manually
- Simulated times are the result of a simulation
- Analyzed times are the result of a time analysis.
If simulated or analyzed is selected, and no simulated/analyzed time is stored on the operation, the estimated time is used.
If a simulated time is stored on the operation, and simulated time is selected, this time is displayed.
If an analyzed time is stored on the operation, and analyzed time is selected, this time is displayed.
The Manufacturing System Gantt displays the time stored on the operation.
Note: The cycle time used by the time solver and displayed in the Gantt is the one stored on the root System of the session, not on the System selected when opening the Gantt.
For more information, see About Time Types on Operations.
![]()
Setting Scale Units
To set the scale units of the Manufacturing System Gantt chart, right-click the title bar showing the time units and select Set Scale Units.
The dialog box that appears allows you to set the time
units (seconds, minutes, and so on), the zoom, and the scale to be applied
to the Gantt chart.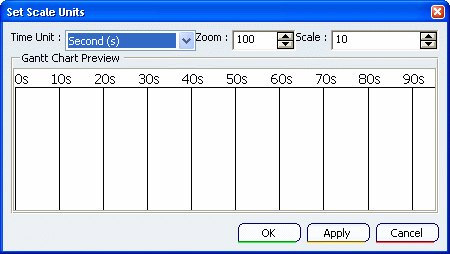
A preview allows you to try out any entered values before accepting them.
![]()
How to Modify the Duration of an Operation
In the Manufacturing System Gant chart, time is editable if it concerns an operation (and not a system) which has no child and it is displayed in Estimated time.
The estimated time is the only time which can be modified manually. Simulated and analyzed times are deduced, so they cannot be modified by setting a value.
To modify the estimated duration of an operation, do one of the following:
- Right-click the Operation, select Properties then modify the Estimated time value.
- In the Gantt chart, double-click on the Duration column and modify the value in the pop-up that appears.
- In the Gantt chart, double-click on the End Time column and modify the value in the pop-up that appears.
- In the Gantt chart, increase the length of the bar representing the operation.
Double-click the bar representing the operation. This lets you modify the duration as well as the name of the operation.
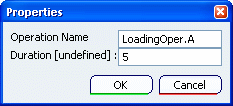
Note: The operation must not have any children. An operation which has children is like a system: its duration is the sum of all the durations of its children.
When an operation duration is 0, the operation is represented by a red symbol as shown below:

Note: Begin time is not editable. Begin times are deduced by solving the constraints set. You cannot manually set a start time for an operation or a system.
![]()
How Links between System, Operation and Resource are Displayed
The three kinds of links that are available between operation and resource (that is, Execute, Used and Where) are displayed in Manufacturing System Gantt chart.
The resources assigned to an operation are listed in three columns in the Gantt chart: Executing Resource, Used Resource(s) and Localized Resource.

For more information, see Line Balancing User's Guide: Resource to Operation Assignments.