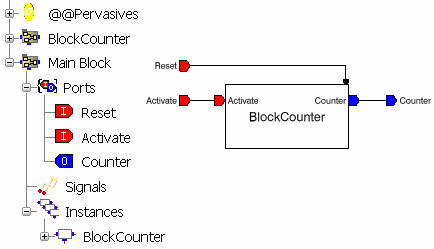
Edit a Logic representation. See
a typical example below.
This program is a simple counter. The
main block calls the instance of the counter block.
The input Activate triggers the run of the
counter. The input Reset resets the counter's
value to zero.
Click Debug
 and select the block you want to simulate in the logic
tree (Main Block in our example).
The program is compiled and the simulation
toolbars and windows appear:
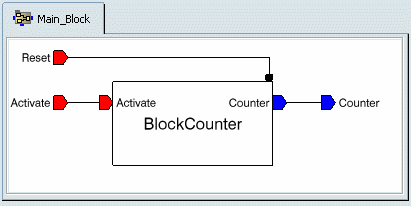
Logics Monitoring displays
the content of the block.
Note: Zoom and Pan
commands are available in this window.
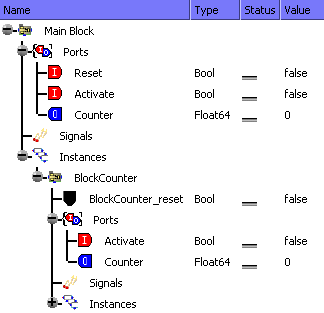
Signals Monitoring displays
the tree structure of the block and its instances.
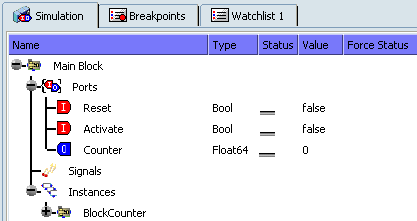
Click
 in the Signals Monitoring to display the
structure of the nodes Ports and Instances.
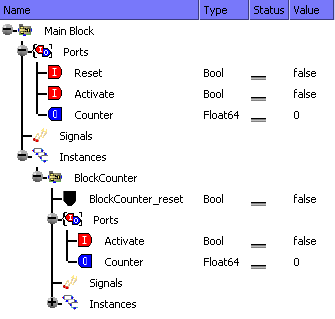
In the Logics Monitoring
window, double-click the block Counter Instance
to display its reference.
A new tab is added to the Logics
Monitoring window.
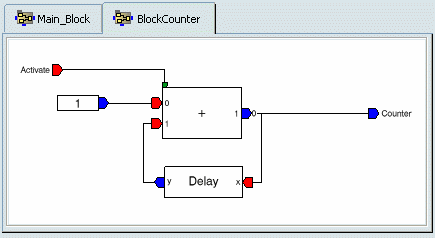
Note: You cannot open the blocks
+, Delay and 1 because
they are pre-defined blocks. Only user-defined blocks
can be viewed in the Logics Monitoring window.
In the Signals Monitoring
window, force the value of the Activate input
to true and press Return.

Click Play Step Forward
in the Simulation Player toolbar.
One step is computed. The step number is set to 1 in the Simulation Player toolbar.
The block + is activated
by the true value of the Activate
input.
The inputs of the + block
are:
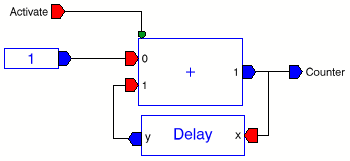
The first step, the output value
is 1.
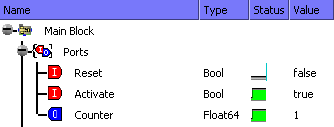
Click Play Step Forward
again in the Simulation Player toolbar. The
output Counter is incremented.
Right-click the Reset
row in the Signals Monitoring window and
select Insert 'Reset' to > WatchList 1.
Repeat the previous step and add
Counter in Watch List 1.
Switch to the Watch List 1
tab, Reset and Counter appears in the list.
Click Play Forward in
the Simulation Player toolbar. The value
of Counter is incremented continuously.

Click Pause.
In
the Simulation Player toolbar, enter a step number (greater than the current one displayed) and press Enter.
The simulation is executed until the step number is reached. Meanwhile, the Signals and Logics Monitoring windows are not updated.
Click the commands of the Simulation Tools toolbar to hide the Logics Monitoring window.
Click Play Forward in
the Simulation Player toolbar.
In the Signals Monitoring window, right-click the Counter
row and select Plot 'Counter'.
The
Plot window appears. The vertical axis is
the value of port, the horizontal
axis is the virtual time (a simulation step matches 100ms).
The axis are automatically redrawn to
fit the graph.
Zoom and Pan commands
are available in this window.
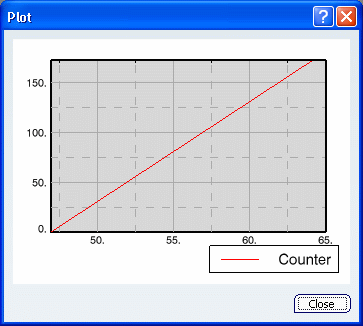
Click Close.
Click Pause in the
Simulation Player toolbar.
Click Jump To Begin in the Simulation Player toolbar.
The step number is set to 0. All the ports values are reset.
Click Debug to stop the
simulation.