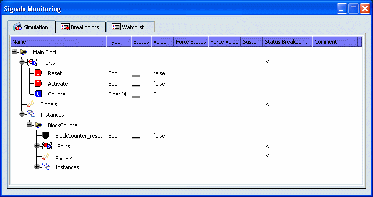
Signals Monitoring Window | ||
| ||

Simulation
- Specification Tree
-
The Simulation tab displays the tree structure of the block and its instances. Also from this tab, you can:
- read the value or state of any port or signal
- force the state of any port or signal
- plot the value of any port and signal.
Column Description Name Display the tree structure of the block and its instances. 
 SFC+ block or instance
 Dataflow block or instance
 Output port
 Input port
 Input/Output port
 Signal
 Reset port of an instance
 Activation port of an instance
Commands
 Click on the + to expand the structure.
Type Display the data type Status Display the state of ports and signals  Emitted
 Not emitted
Value Display the value of ports and signals Force Status Click the field to force the emission of the port or signal the next simulation step. Force Value You can enter the value of the port or signal in this field. This value will be taken into account the next cycle. If the value of the signal or port is computed by the simulation, the Force Value overwrittes the value computed by the simulation. Note: For Enum types, select the values in the drop-down box. Select blank to cancel the force.
Sustain Click the field to sustain a signal or a port. 
Sustain means that the port or signal value is locked to the value of the current cycle and the status is locked to Emitted.
Only the Force Value can change the value of the port/signal when it is sustained.
The status can't be set to Not emitted.
Status Breakpoint Click the field to set a breakpoint on the signal or port emission.  When a breakpoint is set, the simulation is stopped when the signal
is emitted.
Comment Display the comment associated to the port or signal.
- Contextual Menu
-
You can right-click any element of the tree to access
the following contextual commands:

Add a new Watchlist tab. Insert the element inside a Watchlist tab.
![]()
BreakPoint tab
The breakpoint tab gathers all the breakpoints set in the simulation, that is to say, breakpoints set in a SFC editor tab of the Logics Monitoring window or breakpoints set in the Simulation or Watchlist tabs of the Signals Monitoring window.
- Contexual Menu of the tab
-

Remove all the breakpoints - Contextual menu of ports or signals
-

Insert the selected element to a new watchlist tab or insert the element in an existing watchlist.
Plot the value of the port or signal during the simulation.
![]()
Watchlist (n) tab
WatchLists display a user-defined subset of the application's data.
The data displayed and the commands are the same as the Simulation tab.
- Contexual Menu of the tab
-

Create a new watchlist
Remove all the elements from the watchlist
Delete the current watchlist tab
- Contexual menu of any elements
-

Insert the selected element to a new watchlist tab or insert the element in an existing watchlist.
Remove the element from the watchlist
- Contexual menu of ports and signals
-

Add a new Watchlist tab or insert the element in an existing watchlist.
Plot the value of the port or signal during the simulation.
