Logics Monitoring Windows | ||
| ||
SFC+ Editor Tab
This tab is only available for SFC+ block.
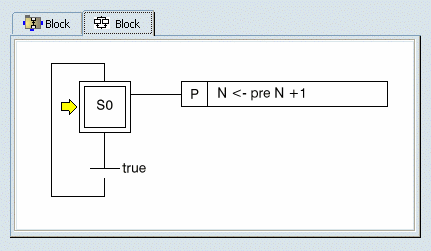
- Highlight
-
During the program execution, the logic is highlighted:
- Blue colored items mean they were processed (action) or evaluated (transition) during the last application cycle.
- A yellow arrow points the step or the state the next cycle will start from.
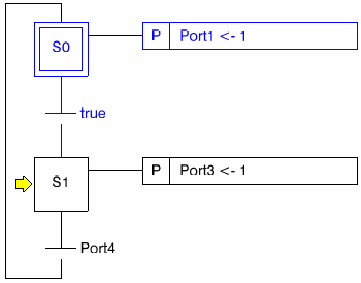
- Macro
-
- To display the logic of an SFC+ macro, double-click the macro's action.The SFC graph of the parent is replaced by the SFC graph of the macro.
- To go back to the macro's parent logic, right-click
Level Up in the window.

- Instance
-
- To display the logic of a block instance, double-click the run instance action. If the instance is a SFC block, a Block Editor tab and SFC Editor tab are added. If the instance is a Dataflow block, only a Block Editor tab is added.
- To go back to the logic of the father block, right-click in the window and select Go to Father.
- To close the instance's tab, right-click in the
window and select Close.

- BreakPoint
- Click inside a step to add a breakpoint. After the execution of the flagged step, the simulation is paused.
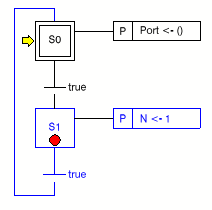
In the Signals Monitoring window, a line is added to the Breakpoint tab.To remove the breakpoint, click the red point in the Signals Monitoring or the Logic Monitoring window.
![]()
Block Editor Tab
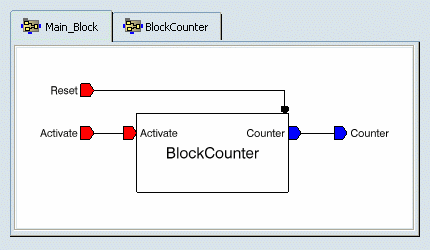
- Highlight
-
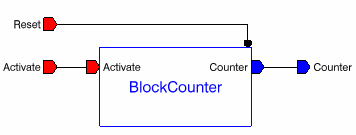
During the program execution, the running blocks are highlighted in
blue.
- Tool Tips
-
You can move your cursor over the ports to see a short help text
about the port: value and status of the port are displayed.

- Instances
- To display the logic of an instance, double-click the block instance. If the instance is a SFC block, a Block Editor tab and SFC Editor tab are added. If the instance is a Dataflow block, only a Block Editor tab is added.
- To go back to the logic of the father block, right-click in the window and select Go to Father.
- To close the instance's tab, right-click in the window and select Close.