Debugging a SFC+ Graph | |||
| |||
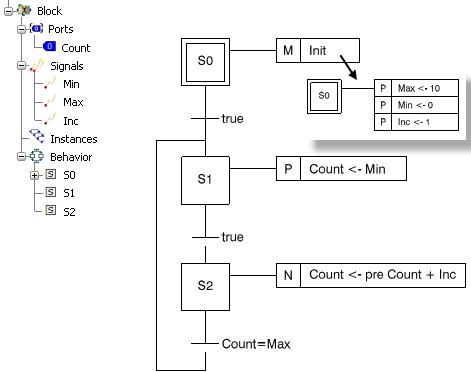
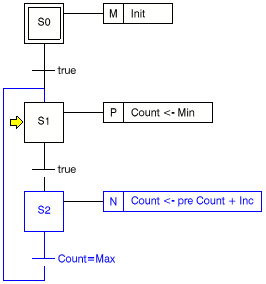
Open a Logic representation. See a typical example below.
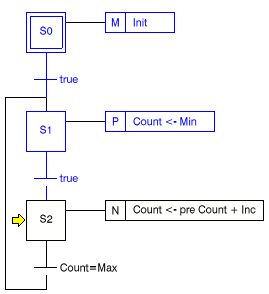
This program is a simple counter.
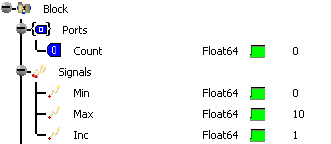
In the initial step, the minimum, maximum and increment value of the counter are defined.
At the second step, the minimum value is affected at the counter value.
At the third step, the previous value of the counter is incremented of the value of Inc until the maximum value of the counter is reached.
Click Debug
 and select the block you want to simulate in the specification
tree (Block in our example).
and select the block you want to simulate in the specification
tree (Block in our example).The program is compiled and the simulation toolbars and windows appear:
Logics Monitoring Windows window
Signals Monitoring Window window
Simulation Player toolbar
Simulation tools toolbar.
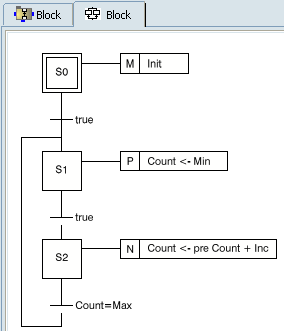
Logics Monitoring displays the content of the block and SFC+ editor. Note: Zoom and Pan commands are available in this window.
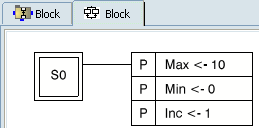
Note: As no block behavior is defined, the tab
 is empty.
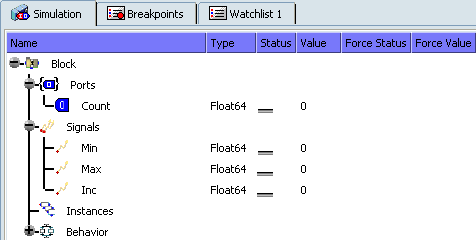
Signals Monitoring displays the tree structure of the block and its instances.
Double-click the Init macro in the Logics Monitoring window to review its content.
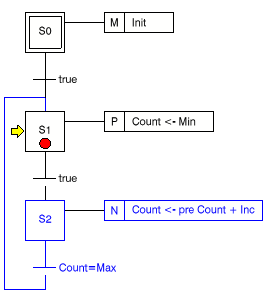
Click Play Step Forward in the Simulation Player toolbar.
As the transition between the first two steps has no pause, the two steps are computed in one cycle. The values of all the ports are assigned.
In the Logics Monitoring window, the blue items have been processed (actions) or evaluated (transitions) the previous cycle. A yellow arrow points the next active step.
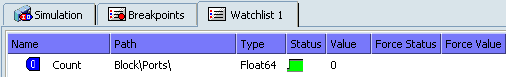
Switch to the Watch List 1 tab, Count appears in the list.
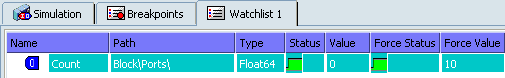
In the column Force Value, enter 10 and press Enter.
Click Play Step Forward in the Simulation Player toolbar.
The condition Count=Max of the transition is true, the next active step is S0.
Click in the S1 step to add a breakpoint.
Select the Breakpoints tab in the Signals Monitoring window.
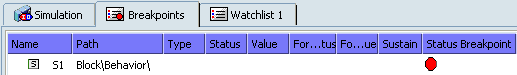
You can see that the step S1 is added to the tab.
Tip: You can also add breakpoints on the emitted status of any port or signal by clicking the Breakpoints Status cell in the Simulation or WatchList tabs. Click Play Forward.
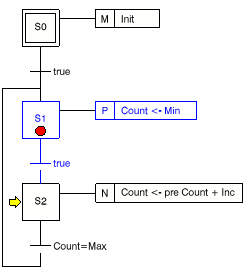
The simulation is paused after the execution of the step S1.
Right-click the Count row and select Plot 'Count'.
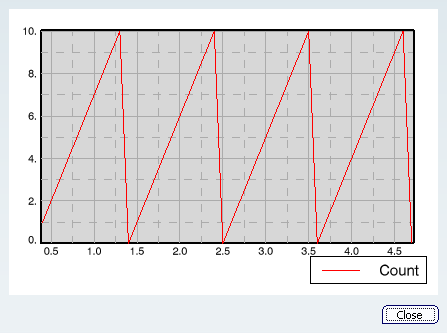
Important: The command Plot is only available with CATIA System license. The Plot window appears. The vertical axis is the value of the port, the horizontal axis is the virtual time (a simulation step matches 100ms).
The axes are automatically redrawn to fit the graph.
Zoom and Pan commands are available in this window.
Click Play Step Forward in the Simulation Player toolbar.
The simulation is run continuously.
| Tip: You can also use the Play of the compass to launch a debug session. The features are similar except the Simulation Player toolbar replaced by the control bar above the compass. |