Displaying Curves Coordinates along the X-axis | |||||
|
| ||||
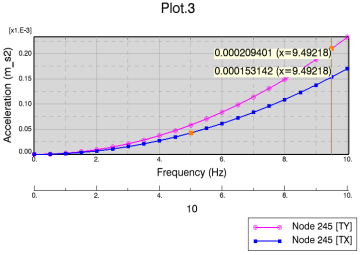
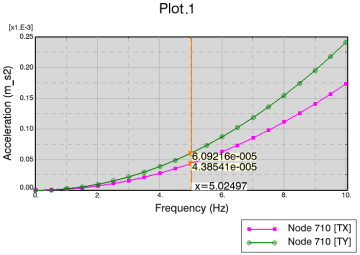
Right-click anywhere in the chart area, and select the Cursor Along X Axis option.
A vertical line appears by default in the middle of the X-axis.
To deactivate this option, right-click anywhere in the chart area, and select the Cursor Along X Axis option.
If you have several curves and X-axes, the X coordinates are displayed at each intersection point between the curves and the vertical line.