Managing the Visualization

You can manage the visualization of the different simulation categories either from the Finite Element Modeling workbench or the Structural Analysis workbench (specifications and results). CATIA can automate the management of the visualization of simulation data. To learn more, see General.

  1. In the Visualization Tools toolbar, click Visualization Management .

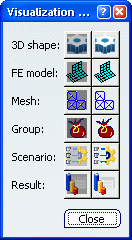
    The Visualization Management tool box appears.

    This tool box allows you to hide or show the geometry (3D shape), the content of the finite element model representation (FE model), the meshes (Mesh), the content of groups (Group), the specifications of the simulation (Scenario) and the results of the simulation (Result).

  2. Click a button of the first column to hide all objects in session that belong to the same category, and click a button of the second column to show them again.

  3. Click Close.

Example

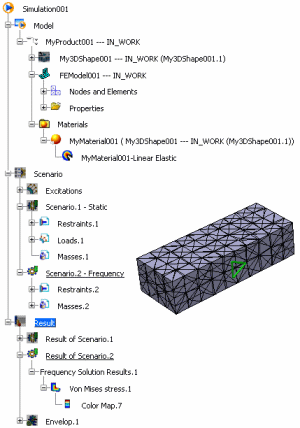
Consider the following configuration: a structural analysis simulation that contains specifications and results (obtained by default after the computation of a frequency scenario and the creation of a von Mises image).
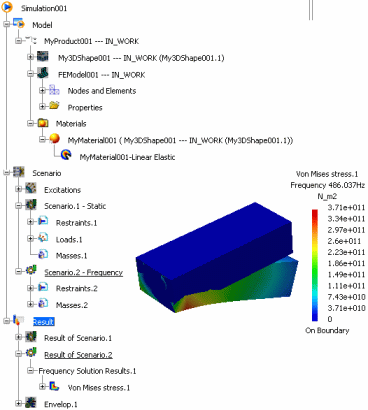
The 3D shape, the finite element model and the scenario category are hidden.

Show the finite element model and hide the results: the mesh is now displayed and the result category and all its content is hidden.