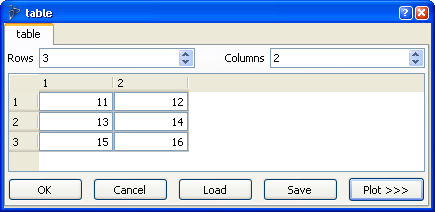
Click Edit  after the matrix input field.
The matrix editor appears.

Modify a value with one of the following methods:
-
Edit directly a cell.
-
Right-click a cell and select Edit Text in the contextual menu to use a text editor.
- Right-click a cell and select Insert Function Call in the contextual menu.
A browser appears to let you insert a function call (for example, you can apply "sinus" on a value).
For more information about function calls, refer to Calling Functions from a Library.
To plot a matrix:
- Click Plot.
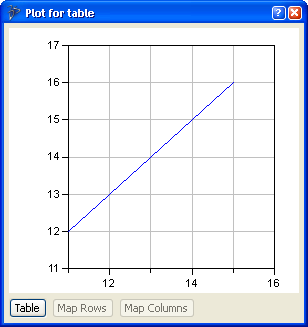
A plot window is displayed.

- Click Table to plot column from 2 to N versus first column.
Note:
Vectors are plotted against index number.
- Click Map Rows to plot rows of a 2D map.
The plotter displays rows from 2 to N versus first row, except the first element.
- Click Map Columns to plot columns of a 2D map.
The plotter displays columns from 2 to N versus the first column, except the first element of each column.
To load a matrix/array, click Load to load a Matlab 4 files (.mat) or comma separated values files (.csv and .txt).
A browser appears to let you select and load the convenient file.
Note:
You have to supply a table name if the file contains several matrices/arrays.
To save a matrix/array, click Save.
Note:
You have to supply a table name if the file contains several matrices.
A browser appears to let you select the convenient folder and enter a file name.
Note:
You have to supply a table name if the file contains several matrices/arrays.
To end the matrix/array edition, select:
- OK: to validate your modification and close the matrix editor.
- Cancel: to cancel your modification and close the matrix editor.