Running a Simulation | |||
| |||
Open an organizational resource (see a typical example below).
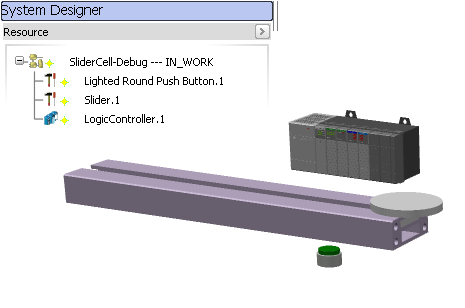
Click the root SliderCell-Debug to edit its logic tree.
Select the Main block in the tree and select Play
 in the PLM compass.
 The program is compiled and the simulation toolbar and window appear:
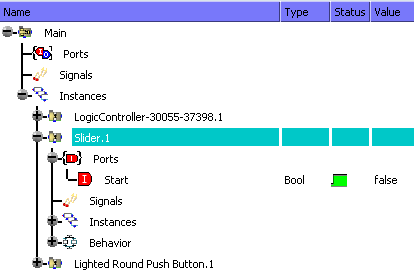
The Signals Monitoring window displays the structure of the cell logic components.
Click Resume
 in the compass control bar to launch the simulation.
Expand the Main block to view the components.
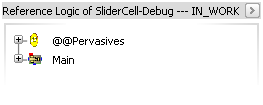
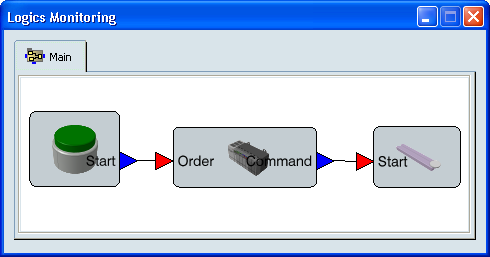
Click Show/Hide Logics Monitoring in the Simulation Tools toolbar. The Logics Monitoring window displays the connection between the sub-resource logics.
Double-click the Push Button instance to display its behavior.
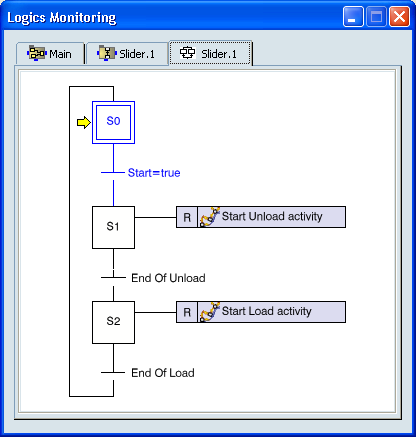
In this example, the instance is an SFC+ block, so two new tabs are displayed: one to edit the block, one to edit the SFC+ graph.
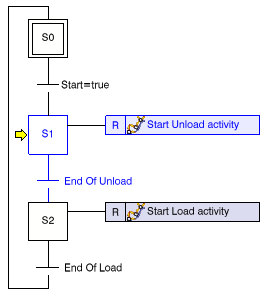
In the SFC+ tab, blue items have been processed (actions) or evaluated (transitions) the previous cycle. The yellow arrow points the next active step.
In this example, to activate the slider, you must click the green button in the 3D view. The order is sent to the controller which forwards it to the slider. The slider starts moving.
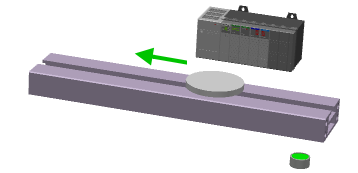
You can see in the Signals Monitoring window that the slider task Unload is being processed.
The controller has correctly transmitted the order to the slider.
Click in the S2 step to add a breakpoint.
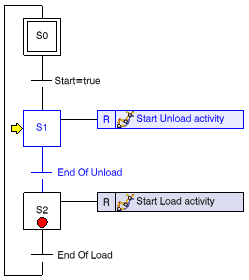
A red dot is added to the step. When the slider reaches the end, the simulation is set to pause.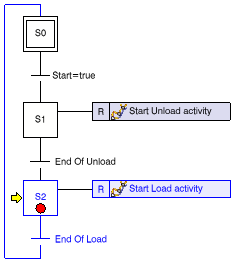
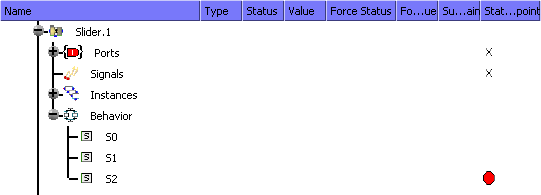
Expand the Slider instance in the Signals Monitoring window, you can see that the breakpoint is added to the step S2.
Click the tab Breakpoint in the Signals Monitoring window, you can see the list of the current breakpoints.

You can use the watch lists to display a set of ports and/or signals. Right-click a port or a signal in the Simulation tab of the Signals Monitoring window and select .
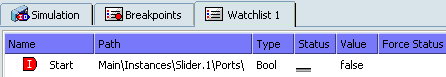
The same commands are available in the Simulation and the Watchlist tab.