Statistics | ||
| ||
General
The General frame contains options common to all statistics reporting operations:

- Buffer's size
- Size of buffer file in Kbytes. The log file is only written to disk once the log file size exceeds the buffer size you set. The values which can be entered in the editable field are limited. Buffer size is limited to 1024KB (1 MB). The values entered are in KB.
- File's maximum size
- Sets the maximum log file size. Each time this size is exceeded, the file is written to the location you specify by navigating using the file selection box in the Maximum number of copies and location option. The values which can be entered in the editable field are limited. The file size is limited to 2.097.152KB (2 GB).
- Maximum number of copies and location
-
Sets the maximum number of copies of the statistics file, and the location in which the copies are stored on the disk. Once the size of the file exceeds the size set by the option File's maximum size, a copy of the file is written to the specified location. This helps to optimize disk space. Once the maximum number of copies is reached, the oldest log file is deleted.
The number of copies is limited to 999 (you can only enter 3 digits in the field).
- Disk-Full Condition Management
- The error logging software will detect disk-full conditions. If you set a maximum number of copies of the statistics file and a directory location to which copies are saved, the error logging software will move the file to the destination directory and try to continue logging. If you do not set a directory (or if after the copy the disk is still full), the error logging software will cease error logging until the end of the current session.
![]()
Statistic Thematics List
You can log statistics for the following types of activities:
- time spent in workbenches
- time spent using specific commands in those workbenches
- session statistics
- error log statistics
- PCS statistics
- audit statistics
- activity statistics
- network statistics.
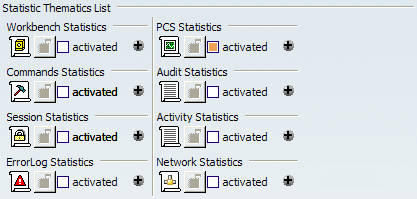
Check the appropriate check button to activate the statistics.
![]()
Additional Statistics
Click the "+" button to access the Additional Statistics dialog box:

which groups together a number of general output options allowing you to specify where and how statistics are recorded, and optional fields you may want to log in the statistics output files.
- General Output
-

Basic statistics are common to all options. Error log statistics contain extra options.
There is a single log display mode:
- File: the log is written to the file whose default name is Thematic.log (where Thematic is the name of the thematic) when you exit the session, in the location pointed to by the CATErrorLog variable. Consequently, the files are written by default to:
CSIDL_LOCAL_APPDATA\DassaultSystemes\CATTemp\Statistics\Thematic.log
but you can specify the file name (by typing a new name and deleting default_file) and output directory of your choice.There are two log update modes:
- Cumulated: the log is written to the existing log
- Session: A new log file is generated at each session.
- Optional Fields
-
This field contains the list of statistics options common to all thematics: theme, date and time, elapsed time, response time, CPU, User, Host and PID:

Futhermore, there can be additional options depending on the thematic.
- Notes about output logs
-
Event dates in the output file are not organized in chronological order. A statistics event is always logged when it is terminated. The start date and duration are specified. Events are generated in event termination chronological order. Because the statistics software allows interlaced or embedded events, events do not necessarily end in the order in which they began.
The two start and end slots indicate the same time. A statistics event is always logged when it is terminated. The start time and duration are specified. The corresponding session event is generated at the end of the session: it started at the beginning of the session and lasts the duration of the session. Due to the possibility of having several successive session statistics in the same session, it is necessary to physically log the start of a session. This is the session start event (whose duration is null). The two events are generated at the same time in the code. To determine the end time, information is provided for the start date and duration. - Enable Statistics Event Scheduling option
-
With the increasing number of statistics thematics supported, it is useful to track statistics events and then be able to extract easily their sequences when several thematics records are merged in the same output.
The statistics process is based on twin calls (begin/end events). The begin event specifies the start of the statistics measurement. Certain data are initialized during this step. The end event is executed to finalize the measurement (elapsed time for example) and dump the statistics fields to the selected output.
This sometimes makes it difficult to follow the chronological sequence of the logged statistics, particularly for nested events.
The Enable Statistics Event Scheduling option provides the capability to track separately the beginning and the end events of a given statistics log process. When statistics events scheduling is set, each log line is split into two complementary lines. The beginning of these lines starts with the same field containing a "unique" identifier so that they can be associated easily.
For example, if event scheduling is not set, typical output looks like this:
them=ERRORLOG:time=Wed Sep 17 16.06.14 2008:elps=0,00000:rtim=0,00000:cpus=0,00000: cmd=ErrorLogCmdAddin:msg="Hello..."
But if you do set event scheduling, the output includes "bevt" and "eevt" tags for each event and looks like this:
bevt=00000143:them=ERRORLOG:time= Wed Sep 17 16.06.14 2008:cmd=ErrorLogCmdAddin
eevt=00000143:them=ERRORLOG:elps=0,00000:rtim=0,00000:cpus=0,00000:msg="Hello..."
This is particularly useful when writing several different statistics to the same log, and you want to see the whole sequence of nested events logged and in chronological order.
For example:
bevt=0000001:them=NETWORK:time=Wed Mar 04 11.31.24 2009:level=0:ComSidl=NbRequest
eevt=0000001:them=NETWORK:elps=0.000:rtim=0.000:cpus=0.000:statocc=4.0000
bevt=0000002:them=NETWORK:time=Wed Mar 04 11.31.24 2009:level=0:ComSidl=RequestSize
eevt=0000002:them=NETWORK:elps=0.000:rtim=0.000:cpus=0.000:statsum=1332.0000
bevt=0000003:them=NETWORK:time=Wed Mar 04 11.31.24 2009:level=0:ComSidl=RequestNetSize
eevt=0000003:them=NETWORK:elps=0.000:rtim=0.000:cpus=0.000:statsum=1332.0000
bevt=0000004:them=NETWORK:time=Wed Mar 04 11.31.24 2009:level=0:ComSidl=NbResponse
eevt=0000004:them=NETWORK:elps=0.000:rtim=0.000:cpus=0.000:statocc=4.0000
bevt=0000005:them=NETWORK:time=Wed Mar 04 11.31.24 2009:level=0:ComSidl=ResponseSize
eevt=0000005:them=NETWORK:elps=0.000:rtim=0.000:cpus=0.000:statsum=3985374.0000
bevt=0000006:them=NETWORK:time=Wed Mar 04 11.31.24 2009:level=0:ComSidl=ResponseNetSize
eevt=0000006:them=NETWORK:elps=0.000:rtim=0.000:cpus=0.000:statsum=482435.0000
bevt=0000000:them=SESSION:time=Wed Mar 04 13.48.09 2009:user=SES:host=STEVANDSY:upid=2820:MainName=CNEXT
eevt=0000000:them=SESSION:elps=9572860.000:rtim=9572860.000:cpus=109390.000:ExitStatus=normal_end
![]()
Logging Workbench Activity
Example of formatted traces for a workbench log:
...
them=WORKBENCH:time=Wed May 22
10.29.02 2002:elps=0.000000:rtim=0.000000:cpus=0.000000:Session=Start:User=SES:Host=JANEDSY
WORKBENCH: Wed May 22 10.38.57 2002:0.000000:0.000000:0.000000:Start:SES:JANEDSY
them=WORKBENCH:time=Wed May 22 10.39.32 2002:elps=5888.000000:rtim=861.000000:cpus=370.000000:Workbench=CATDrwDrwWkb:NLS=Drafting
them=WORKBENCH:time=Wed May 22 10.39.38 2002:elps=3213621.000000:rtim=901.000000:cpus=170.000000:Workbench=CATPstProductWkb:NLS=Product Structure
them=WORKBENCH:time=Wed May 22 11.33.12 2002:elps=4567.000000:rtim=270.000000:cpus=130.000000:Workbench=CATCuiCATALOGWks:NLS=Catalog Editor
them=WORKBENCH:time=Wed May 22 11.33.16 2002:elps=3866.000000:rtim=100.000000:cpus=60.000000:Workbench=CATMaterialWorkshopWks:NLS=Material Library
them=WORKBENCH:time=Wed May 22 11.33.20 2002:elps=3585.000000:rtim=100.000000:cpus=90.000000:Workbench=CATAifAssemblyWkb:NLS=Assembly Design
them=WORKBENCH:time=Wed May 22 11.33.24 2002:elps=50.000000:rtim=50.000000:cpus=40.000000:Workbench=CATMaterialWorkshopWks:NLS=Material Library
them=WORKBENCH:time=Wed May 22 11.33.24 2002:elps=40.000000:rtim=40.000000:cpus=30.000000:Workbench=CATCuiCATALOGWks:NLS=Catalog Editor
them=WORKBENCH:time=Wed May 22 11.33.24 2002:elps=1833.000000:rtim=120.000000:cpus=110.000000:Workbench=CATAifAssemblyWkb:NLS=Assembly Design
Example of non-formatted traces:
WORKBENCH:Wed May 22 11.36.17 2002:48690.000000:341.000000:300.000000:Workbench=CATAifAssemblyWkb:NLS=Assembly Design
WORKBENCH:Wed May 22 11.37.06 2002:2173.000000:481.000000:290.000000:CATPstProductWkb:Product Structure
WORKBENCH:Wed May 22 11.37.08 2002:11517.000000:1832.000000:1451.000000:CATPcfPartWkb:Part Design
WORKBENCH:Wed May 22 11.37.21 2002:4877.000000:471.000000:430.000000:CATDrwDrwWkb:Drafting
WORKBENCH:Wed May 22 11.37.26 2002:4747.000000:491.000000:120.000000:CATHybridPartWorkbenchWkb:Hybrid Part Workbench
WORKBENCH:Wed May 22 11.37.31 2002:50.000000:50.000000:30.000000:CATDrwDrwWkb:Drafting
WORKBENCH:Wed May 22 11.37.31 2002:1292.000000:70.000000:60.000000:CATHybridPartWorkbenchWkb:Hybrid Part Workbench
Note that:
- Workbench = internal workbench name
- NLS = NLS name of the workbench (the name which appears in the Start menu).
![]()
Logging Command Activity
Here is the log syntax:
them=COMMAND:time=Wed May 22 10.05.17 2002:elps=8993.000000:rtim=7491.000000:cpus=630.000000:Command=FileNew:NLS=New...:CurrentWorkbench=CATPstProductWkb:NLS_CurrentWorkbench=
Product Structure:Origin_Header=Global:mode=ForegroundCmd
where:
them: theme (command in this case)
time: time
elps: elapsed time spent in the command.
rtim: "response time", which is the ellapsed time minus user wait time.
Cpus: cpu time spent is the command.
Command: internal command name
NLS: external command name
CurrentWorkbench: internal current workbench name
NLS_CurrentWorkbench: external current workbench name
Origin_Header: origin header
mode: background or foreground mode.
This trace will be logged when you exit the command. The workbench name is the current workbench when you exit the command.
Note that certain auxiliary commands (for example, the Search command) are not logged.- Example of formatted traces for a command log
-
them=COMMAND:time=Fri Jan 21 14.44.36 2005:elps=0.000000:rtim=0.000000:cpus=0.000000:user=ses:host=JANE2DSY:upid=3168:Session=Start
them=COMMAND:time=Fri Jan 21 14.44.43 2005:elps=3828.000000:rtim=94.000000:cpus=76.000000:user=ses:host=JANE2DSY:upid=3168:Command=FileNew:NLS=New...:CurrentWorkbench=CATPstProductWkb:NLS_CurrentWorkbench=Product Structure:Origin_Header=Global:mode=ForegroundCmd
them=COMMAND:time=Fri Jan 21 14.44.36 2005:elps=11219.000000:rtim=16.000000:cpus=15.000000:user=ses:host=JANE2DSY:upid=3168:Command=Select:NLS=Select:CurrentWorkbench=CATPstProductWkb:NLS_CurrentWorkbench=Product Structure:Origin_Header=Global:mode=ForegroundCmd
them=COMMAND:time=Fri Jan 21 14.44.50 2005:elps=6671.000000:rtim=5234.000000:cpus=406.000000:user=ses:host=JANE2DSY:upid=3168:Command=FileNew:NLS=New...:CurrentWorkbench=CATPstProductWkb:NLS_CurrentWorkbench=Product Structure:Origin_Header=Global:mode=ForegroundCmd
them=COMMAND:time=Fri Jan 21 14.45.01 2005:elps=15343.000000:rtim=15.000000:cpus=0.000000:user=ses:host=JANE2DSY:upid=3168:Command=Select:NLS=Select:CurrentWorkbench=CATPcfPartWkb:NLS_CurrentWorkbench=Part
Design:Origin_Header=Global:mode=ForegroundCmd
them=COMMAND:time=Fri Jan 21 14.45.16 2005:elps=20313.000000:rtim=110.000000:cpus=106.000000:user=ses:host=JANE2DSY:upid=3168:Command=OpenSettings:NLS=Options...:CurrentWorkbench=CATPcfPartWkb:NLS_CurrentWorkbench=Part Design:Origin_Header=Global:mode=ForegroundCmd
them=COMMAND:time=Fri Jan 21 14.45.36 2005:elps=3265.000000:rtim=15.000000:cpus=15.000000:user=ses:host=JANE2DSY:upid=3168:Command=Select:NLS=Select:CurrentWorkbench=CATPcfPartWkb:NLS_CurrentWorkbench=Part
Design:Origin_Header=Global:mode=ForegroundCmd
them=COMMAND:time=Fri Jan 21 14.44.47 2005:elps=52641.000000:rtim=2281.000000:cpus=416.000000:user=ses:host=JANE2DSY:upid=3168:Command=Select:NLS=Select:CurrentWorkbench=CATPstProductWkb:NLS_CurrentWorkbench=Product Structure:Origin_Header=Global:mode=ForegroundCmd
them=COMMAND:time=Fri Jan 21 14.45.40 2005:elps=78.000000:rtim=62.000000:cpus=62.000000:user=ses:host=JANE2DSY:upid=3168:Command=FileExit:NLS=Exit:CurrentWorkbench=CATPcfPartWkb:NLS_CurrentWorkbench=Part
Design:Origin_Header=Global:mode=ForegroundCmd
them=COMMAND:time=Fri Jan 21 14.44.36 2005:elps=64094.000000:rtim=7641.000000:cpus=946.000000:user=ses:host=JANE2DSY:upid=3168:Session=End
- Example of non-formatted traces for a command log
-
COMMAND:Wed May 22 10.29.14 2002:7051.000000:171.000000:160.000000:Command=OpenSettings:NLS=Options...:CurrentWorkbench=CATAifAssemblyWkb:NLS_CurrentWorkbench=
Assembly Design:Origin_Header=Global:mode=ForegroundCmd
COMMAND:Wed May 22 10.29.21 2002:2673.000000:30.000000:30.000000:Select:Select:CATAifAssemblyWkb:Assembly
Design:Global:ForegroundCmd
COMMAND:Wed May 22 10.29.24 2002:1392.000000:31.000000:30.000000:PasteSpecial:Paste Special...:CATAifAssemblyWkb:Assembly
Design:Global: ForegroundCmd
COMMAND:Wed May 22 10.29.25 2002:2003.000000:21.000000:10.000000:Select:Select:CATAifAssemblyWkb:Assembly
Design:Global:ForegroundCmd
COMMAND:Wed May 22 10.29.00 2002:27429.000000:70.000000:10.000000:Command=AnalyserCmd:NLS=AnalyserCmd:Origin_Header=Global:mode=
BackgroundCmd
COMMAND:Wed May 22 10.29.27 2002:50.000000:50.000000:40.000000:FileExit:Exit:CATAifAssemblyWkb:Assembly
Design:Global:ForegroundCmd
![]()
Logging Session Statistics
The Session Statistics theme records information about application sessions (duration, start date, exit status). This information is collected via a statistics theme so as to take advantage of the statistics infrastructure (for example, the automatic copy and relocation of statistics files exceeding a determined size).
This information is limited to one event per session. As such, it will help keep track of users' session durations and ending status, providing a supplementary tool to measure MTBF.
When activated, the Session Statistics generates one output line by session on the console or in a file. The default file is:
CATTemp/Statistics/Stats_SESSION_user_HOST
Example of output:
them=SESSION:time=Mon Apr 14 09.12.06 2003:elps=131690.000000:rtim=1112.000000:cpus=110.000000:MainName=CATIA:ExitStatus=normal_end
No output is generated for the session during which the session statistics are activated. You have to exit then restart your Version 5 session, and from then on you will obtain session statistics output for all further sessions.
This new functionality is mainly useful for Version 5 administrators. Session Statistics list all the sessions, their duration, and exit conditions for any or all users, easily providing them with a comprehensive view of the average duration of user sessions and allows a global view of the usage of Version 5 by any user or group of users.
It also provides an idea of the percentage of sessions where no failure occurred.
Session statistics add a global view in addition to the more detailed views already provided by the existing COMMAND and WORKBENCH statistics.![]()
Error Logging Capability
The objective of this feature is to provide a key tool for MTBD tracking.
It will enable to users to detect hidden problems or find areas where improvement should be done, in terms of quality and functionality. Not only failure will be logged but also defects which may cause any sort of problems to the end-user. Typically, it will log pop-up warnings, internal critical errors and failures.
Furthermore, end-users have a user interface allowing them to report defects and describe the problem. This report will be logged in this error log.
- Principal Features
-
- Tools options user interface to activate/customize the error log
- user interface allowing user to report error logging
- logging of all infrastructure warning popups
- logging of all abends/failures
- logging of main applicative popups
- logging of critical internal errors.
- Activating the Error Log
-
- To activate the option, check the "activated" option.
- Click the "+" button to access a dialog box containing more advanced
customization options.
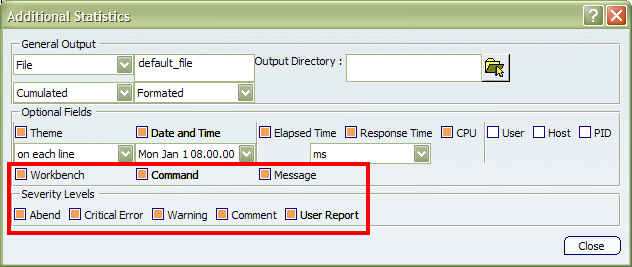
Note that the additional statistics contain extra options for error
logging:
- Description of Error Log Scope
-
Optional Fields contains the following three options specific to error logging:
- Workbench
- Command
- Message
enabling you to specify whether you want to log workbench, command or message activity respectively. When activated, an error log will be generated. This error log contains one line per event. Each event will correspond to a defect.
- Severity Levels
-

The defects may be:
- an abend or failure
- a critical internal error detected by a low layer of the application and which may potentially cause later defects
- a warning pop-up displayed to the end-user
- a comment (indicating surprising or bothersome behavior which is not a defect, for example)
- a user-reported defect.
- Error Log Record Format
-
The error log uses the V5 statistics format. The default record format is:
Log Field Present/Absent in Default Log Comment Thematic Name Present may be discarded by administrator Date/Time of the error Present may be discarded by administrator User ID (Windows) Present may be discarded by administrator Host ID Absent may be added by administrator Process ID Absent may be added by administrator Date/Time of command start Present may be discarded by administrator Workbench Name Present may be discarded by administrator Command Name Present may be discarded by administrator Error/Warning Message Code Present mandatory Message Text Present depends on Error Log option - 1st format style (with field names)
-
them=ErrorLog:time=Mon Apr 14 09.12.06 2003:user=SGT:Workbench=CATPstProductWkb: Command=Select:gravity=warning:msg="Update Error"
- 2nd format style (without field names)
-
ErrorLog:Mon Apr 14 09.12.06 2003:SGT:CATPstProductWkb:Select:warning:"Update Error"
Note: Administrators will be able to lock these settings so that the end-user cannot change them, in which case an end-user will not be able to deactivate error logging.
- User Defect Reporting
-
You can add your own information to the log by checking the User Report option. When you do so, you need to access the Error Log dialog box. To do so:
- Select the View > Toolbars command.
- Select the Error Log toolbar. The toolbar is displayed.
- Select the Error Log toolbar to display the Error Log dialog box:

- Perform a scenario in which you observe a problem which has surprising or bothersome behavior and which is not a defect.
- Specify the severity level and enter a comment in the Message field to describe the problem.
- Exit your Version 5 session.
- Location of Error Log
-
The log is located in the location referenced by the CATTemp variable. For example, the default location (on Windows) of the error log is:
C:\Documents and Settings\user\Local Settings\Application Data\DassaultSystemes\CATTemp\Statistics
![]()
Logging PCS Traces
System PCS (performance, capacity and scalability) traces have been provided to be able to measure CPU and memory consumption in client and server scenarios for CATIA, ENOVIA and VPMV5 applications.
This tool is designed to:
- determine the main PCS costs of a scenario
- identify the critical points for PCS problems
- obtain customer site PCS information about critical problems without needing too much or confidential data.
A typical scenario for which this tool would be useful is the use of the VPM Nav command in CATIA to open a product root class (PRC) on an ENOVIA V5 server.
This new functionality will provide PCS administrators with more accurate data about memory and CPU use during each step of a scenario.
Note: only client PCS traces are supported in this release.
- Functionalities
-
PCS Statistics allow users to log events and obtain information about CPU and memory consumption during the event.
The PCS thematic has several activation levels. The end user can choose the level of details required for measurements.
Only the event with an activation level less or equal than the activated level are output (more macroscopic events have a lesser activation level.)
This allows you to begin a statistics analysis session by identifying the macro events where a performance problem occurs, then to go gradually to the details to identify the exact layer of software which is causing the problem.
The PCS thematic has a specific option call cumulated stats:
- this option cumulates all the occurrences of the same type (sum of elapsed time, cpu time).
- only one line is generated in the output file: a field in the output specifies the number of cumulated events.
- it is possible to simultaneously have cumulated events and individual
events, depending on their respective levels:
1 < activation level of the event <= selected cumulation level
: one line is generated by eventcumulation level < activation level of the event <=selected activation level
: one line is generated per group of events.
This allows analysis of individual macroscopic events and how their time is divided, without having hundreds of microscopic sub-events.
A command has been provided to define dynamically the start and end of the measurement. Contrary to most other statistics, PCS statistics are meant to be used dynamically PCS statistics are activated by default, but no events will be generated if the user does not specify at least an activation level (cumulation level is optional).
An extra field exists for the memory (start memory and end memory; current memory or last recorded peak, depending on the operating system).
Unlike other statistics, the date parameter provides beginning and end time.
- Activating PCS Statistics
-
The PCS Statistics thematic is activated by default in the Statistics Thematics List.
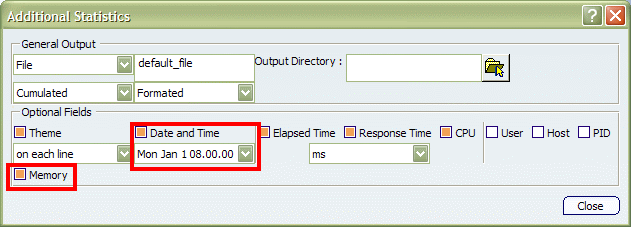
PCS has a new optional field: Memory.
When activated, it generates two fields in the output file:
- memory at the beginning
- and memory at the end
of the statistics event. Depending on the operating system, the value can be the instant memory or the last peak value.
Contrary to all other statistics thematics, when activated, the data and time field generates two fields in the output file, the date and time:
- at the beginning of the event
- and also at the end.
- Activation Level
-
It comprises up to ten activation levels.
Select the View > Toolbars command and check PCS Statistics to display the following toolbar:
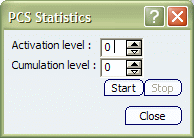
By default, the level is set to "0", which means no traces are generated. Use the Start and Stop buttons to start and stop PCS measuring.
- Cumulation Level
-
This option can be used to condense several events into a single generated line. This provides cpu time, cumulated elapsed times, and an extra field providing the number of iterations.
By default, the cumulation level mode is set to "0", so it is inactive.
If "n" and "m" are event levels:
o<n< cumulation level < m< activation level
An event of level "n" will be detailed (1 line per event).
An event of level "m" will be cumulative (1 line for one or more events).
If you set a cumulation level higher than the activation level, the cumulation level will be set equal to the activation level. - Example of output
-
Example of generated line:
them=PCS:time=Wed Jul 07 16.46.46 2004:end_time = Wed Jul 07 16.46.46 2004 :elps=0.000000:rtim=0.000000:cpus=0.000000
:user=siu:host=DREX1DSY:upid=2756:start_max=15705112:Field1=Value1:Field2=Value2:end_max=1244964
- Limitations
-
To generate an output, two conditions must be fulfilled:
- PCS Thematics must be activated: if not, an error message appears in the PCS panel, and measurement can not start. Furthermore, the activation level of the statistics event must be less than or equal to the level activated in the PCS panel: if not, nothing is output, and no error message appears.
- Depending on the operating system, the names of the values provided
for memory usage vary:
- the value of the current memory: the field names in the output file are "start_mem" and "end_mem"
- the value of the latest memory peak (in this case, the value can only increase during the session): the fields in the output file are "start_max" and "end_max".
![]()
Logging Network Statistics
Network statistics allow monitoring of client/server transactions and detection of poor communications behavior. These statistics are basically logged in the same specific format respecting the statistics management defined for other statistics applications.
Traditional logs are mostly saves as files and dispatched on the end-user machine, so it may be difficult to track in real time the behavior of network transactions. The advantage of the network statistics dialog box is to monitor interactively and more comfortably part of the network statistics during a session, as an alternative to consulting the statistics logs at the end of its session with the corresponding format (File, cumulated, etc...).
- Activating Network Statistics
-
After activating the Network Statistics thematic, Select the View > Toolbars command and check Statistics to display the Statistics workbench icon. Select the icon to display the workbench, then select the network statistics icon (highlighted in red):

to display the Network Statistics dialog box:
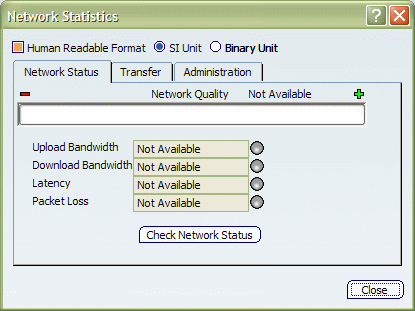
- Functionalities
-
The network statistics session panel offers the capability to view certain types of statistics information in a comfortable format to help you to track network problems. Certain statistics are generated interactively; the other statistics are automatically refreshed in the dialog box.
Certain options are present whatever the tab displayed.
Human readable format: This option enables display of certain statistics sizes in human readable format using a power of 1024 (e.g., 1KiB, 234MiB, 2GiB), etc.
Note that the binary prefix with a power of 1024 is as follows:
KibiByte = "KiB" = 1024 Bytes;
		MebiByte = "MiB";
		GibiByte = "GiB";
		TebiByte = "TiB";
SI Unit: displays information using SI units.
Binary Unit: displays information using binary units.
- Network Status Tab
-
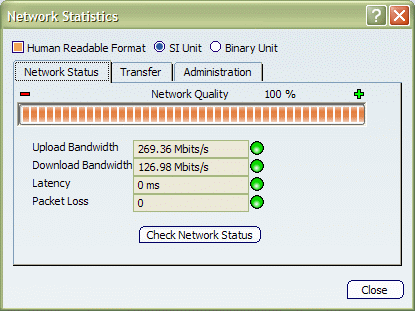
All values listed in the Network status tab are computed only if the user clicks on the Check Network Status button.
Clicking on Check Network Status button will increase the amount of data in the Transfer tab and those data will be send or received without being compressed.
Download Bandwidth and upload bandwidth can have major fluctuation when they are used on a network of 1Gb or above.
Latency can be a little bit different than the result of a ping command as it is http latency. All these values are dependent on server and network performance at the time the test is launched.
Network Quality: Network quality is a summary of the values displayed below in this tab.
The role of this value is to help you to ascertain network quality prior to using Version 6. The value "0" indicates a very poor network performance (or incompatible environment for test) and 100% very good network quality for using Version 6.
All values do not have that same weight. Here are the rules used to compute this value:
A packet loss with a value different from "0" will be considered as a fatal error and this progress bar will be at "0". Otherwise, it will be computed with another value.
For upload Bandwidth and download bandwidth, the weight for the computation is as follows:
- low bandwidth values have the greatest weight
- High bandwidth values have less weight
For latency, the weight for the computation is as follows:
- low latency values have low weight
- high latency values have high weight.
Upload Bandwidth: the amount of data that can be transferred per second from the client to the server. Note that this value is computed at time "t" and represents this amount at time "t". It is also dependent on server and network performance at the time the test is launched.
Download Bandwidth: the amount of data that can be transferred per second from the server to the client. Note that this value is computed at a time "t" and represent this amount at time "t". It is also dependent on server and network performance at the time the test is launched.
Latency: the amount of time that elapses from when the client sends a network packet and when it receives the answer. It is less a question of real latency, and more a question of HTTP latency. The biggest difference is that the time it takes the application server to read the question and answer can be considerably higher than the time it takes to respond to a ping request (ping is normally used to compute latency but usually unusable over a WAN).
Packet Loss: this information is computed at the same time as the latency value and represents the number of requests that have failed due to timeouts.
The Check Network Status button is used to launch all tests that are necessary to compute the above values. This test should not take too long: if so, it means that the network is not correctly configured or has lost too many packets (maximum test time can be around 12 sec on the poorest network possible).
Here is an example:
- Transfer Tab
-
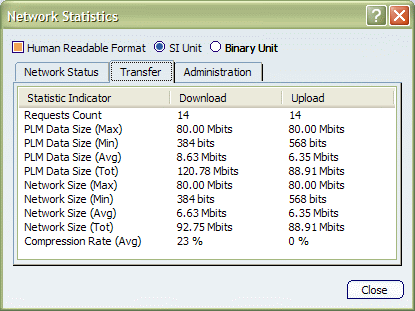
This tab presents all the values for download and upload, which means that download columns represent the statistics response received from the server and upload columns represent statistics response from requests sent to server. All these values are session values and cannot be reinitialized.
Request count: This value represents the number of requests that have been sent.
PLM data size: Represents information about size of PLM data given to the network transfer layer:
- Max: Maximum size for PLM data
- Min: Minimum size for PLM data
- Avg: Average size for PLM data
- Tot: Total size for PLM data
Network Size: represents information about data transferred over network. This value may be smaller than PLM data size if there is compression on PLM data (for very small data it can be bigger because it also includes communication layer headers):
- Max: Maximum size of data transferred over network
- Min: Minimum size of data transferred over network
- Avg: Average size of data transferred over network
- Tot: Total size of data transferred over network
Compression Rate (Avg): average compression rate for PLM data. Here is an example:
- Administration Tab
-
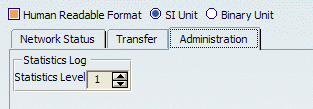
You can select directly the level (0 to 3) of the current network statistics. Note that this option is not a setting: the selected level is for the current session only:
