Signals Monitoring Window | ||
| ||
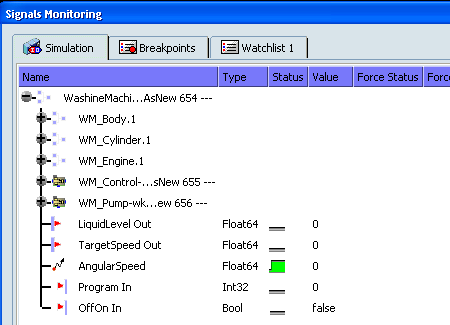
Simulation Tab
The Simulation tab displays the following columns:
- Name
- Displays the direction, the structure and the name of the port/signal.
- Type
- Displays the type of the signals.
- Status
- Displays the status of an input or output:
-
 Emitted
 -
 Not emitted
-
- Value
- Displays the value of an input or output.
- Force Status
- Click the field to force the emission of the signal.
- Force Value
- Enter a value in this field to force the value.
![]()
Watch List Tabs
From the Simulation tab, the contextual menu allows you to isolate, in an existing tab or in a new tab, the simulation for one or several variables.
You can create as many watch lists as necessary.
From the Simulation tab,
- Right-click an input or an output to display its contextual menu.
- Select Insert in a new watch list.
Open the watch list to check your modification.
![]()
Plot Window
From the Simulation tab, the contextual menu allows you to display in a Plot window a 2D graphical view of the virtual execution
From the Simulation tab:
- Right-click an input or an output to display its contextual menu.
- Select Plot a signal or a port.
The Plot window is displayed.
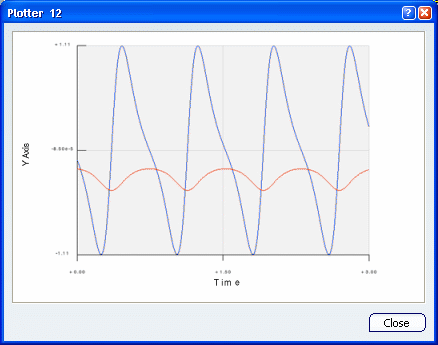
| Warning: From the System Experiment workbench, graphical settings (curve color, chart setup, axis range...) are not available. |
| Important: You can display only one Plot window at a time. If you select several variables, they are plotted in the same Plot window. |