More about Wall Thicknesses | ||||
|
| |||
Inputs Tab
The Input tab allows you to measure thicknesses using various options:
Analysis Method
You can choose between two analysis methods:
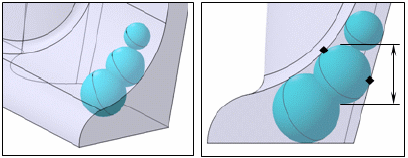
- Sphere: defines the thickness of the body at a given
point as the diameter of the largest sphere that can be included inside
the part at this point (default option).
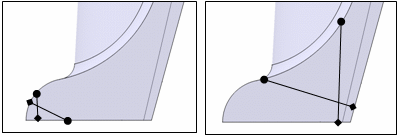
- Ray: defines the thickness of the body at a given point
of a ray that starts at the considered point, that is oriented along
the normal to the solid boundary and that points inside the material.
The part under study determines the method you need to chose.
Tolerance
Tolerance: lets you specify how precise the analysis result will be. For example, if you set the tolerance value to 0.1mm, and the capability calculates 8mm at a given point, the exact thickness is comprised between 7.9 mm and 8.1mm. However, because a tessellated model is used for computation in certain known scenarios the error might be observed to be more than tolerance. This can happen at sharp edges when using Ray.
Sag: is the maximum distance between the geometry and the
triangles. Increasing or decreasing the sag value changes the distance of
the triangle to the surface. If the sag value is low, the triangles are
generated closer to the surface, the tessellation error reduces, but the
number of triangles increases on curved surfaces. This results in higher
accuracy of thickness values but the computation time will be higher.
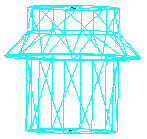
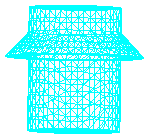
Step: controls the length of the triangle. Increasing or decreasing the step value changes the size of the triangles. A low step results in smaller triangles. Consequently, the number of triangles and vertices increases, making the thickness analysis more accurate but slower.
![]()
Options Tab
The Options tab allows you to measure thicknesses using various options:
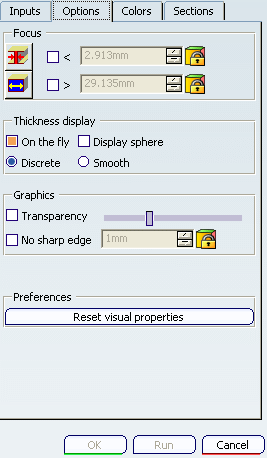
Thin Areas
Clicking this button
![]() restricts the display to the minimum threshold value and shares it
out among the first ranges of the color scale, clears the display boxes
for the upper ranges. Consequently, we only visualize the thinnest thicknesses
through a few colors.
restricts the display to the minimum threshold value and shares it
out among the first ranges of the color scale, clears the display boxes
for the upper ranges. Consequently, we only visualize the thinnest thicknesses
through a few colors.
Thick Areas
Clicking this button
![]() restricts the display to the maximum threshold value and shares it
out among the last ranges of the color scale, clears the display boxes for
the lower ranges. Consequently, we only visualize the thickest thicknesses
through a few colors.
restricts the display to the maximum threshold value and shares it
out among the last ranges of the color scale, clears the display boxes for
the lower ranges. Consequently, we only visualize the thickest thicknesses
through a few colors.
You can edit the thresholds after selecting the check boxes. If these are cleared, the system computes the thresholds.
| Tip: Thin areas and Thick areas offer a quick wall thickness analysis which may produce visual imperfections. |
On the fly
This option lets you dynamically display thickness values as you move your cursor on the part.
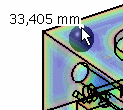
Display sphere
This option is available when On the fly is selected. It shows the sphere under the cursor. The sphere diameter is equal to the analysis value on the point.
By default, Display sphere is cleared.
Display ray
This option is available when On the fly is selected. It shows an arrow representing the ray under the cursor.
Discrete
This option is available when On the fly is selected. It shows calculated values only, which ensures accurate results.
Smooth
This option is available when On the fly is selected. It shows all values whatever your cursor position. The displayed thicknesses are interpolated values, which may lead to some inaccurate results.
Transparency
If selected, this option makes all range colors transparent and lets you see the sphere if you chose the Sphere as Thickness display.
![]()
Colors Tab
The Colors tab allows you to measure thicknesses using the Autoscale and Number options:
Autoscale
Provides dynamic range scaling for the different values. When the option is selected, you therefore cannot define the different values yourself. By default, Autoscale is selected.
If you prefer to define the different thickness values, just clear the option. This makes the value fields available.
![]()
Sections Tab
The Sections tab allows you to measure thicknesses through Dynamic Sectioning.
Section Cut
Clicking the Section Cut
![]() displays
a section plane parallel to absolute coordinates XY. The center of the plane
is located at the center of the bounding sphere around the geometry in the
selection you defined. A plane has limits and its own local axis system.
The letters U, V and W represent the axes. The W axis is the normal vector
of the plane.
displays
a section plane parallel to absolute coordinates XY. The center of the plane
is located at the center of the bounding sphere around the geometry in the
selection you defined. A plane has limits and its own local axis system.
The letters U, V and W represent the axes. The W axis is the normal vector
of the plane.
You can manipulate the plane in a variety of way: re-dimension, move, and rotate it.
![]() By default, Section cut is cleared.
By default, Section cut is cleared.
Specified Location
If the On the fly option is selected in the Options tab, the specified location is the location of the displayed indicator. Otherwise, the point will be under the cursor. In both cases, the Specified Location option stores the section position as well as the the computed thickness at the specified location and the analysis mode (sphere or ray).
| Warning: If you modify the pad, the section cut thickness will be updated when activating the Update option but if the section point is outside the pad, the section cut status will become Unresolved and no thickness will be applied to this cut. This only happens when you add a section at a specified location. |
Add Section
You can create a section through the Add Section
 option. This section then appears in the panel. This option is only available
if the Section Cut functionality is activated.
If you add a section through this option, the section will not have any
specific related thickness.
 deletes any section selected in the panel.
 is only visible when the