To plot:
- an excitation, right-click the excitation under the scenario in the specification tree, and select Plot.
- a selection of excitations, select the excitations you want to plot under a scenario in the specification tree, right-click one of the selected excitations, and select Plot.
- all the excitations of a scenario, right-click the scenario in the specification tree, and select Plot Excitations.
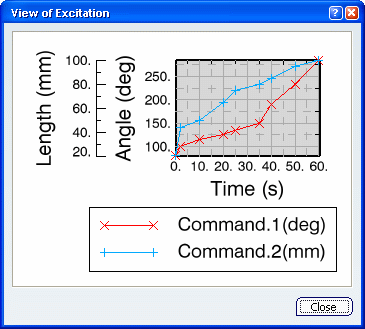
The XY plot opens in a new window, and a curve is created for each excitation you selected in the scenario. For excitations based on a design table or recorded excitations, the curve displays the points that correspond to the values defined in the table.

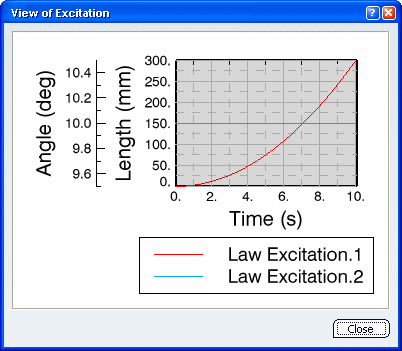
For formula-based excitations, the plot displays a smoothed curve that corresponds to the mathematic definition given by the formula.

Click Close.
|