Click Surfacic Curvature Analysis  in the Shape Analysis toolbar (Draft sub-toolbar).
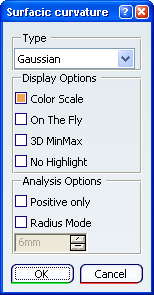
The Surfacic curvature dialog box appears.
The Surfacic Curvature Analysis.x color scale dialog box also appears.
In the Type area, select
Gaussian and in the Display Options area, select Color Scale check box.
Click a surface.
The surface is painted according to the color scale in the dialog box.
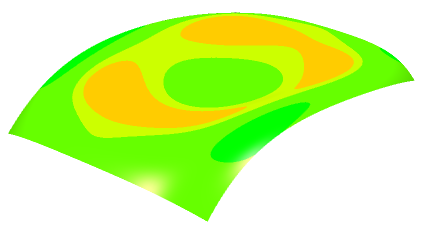
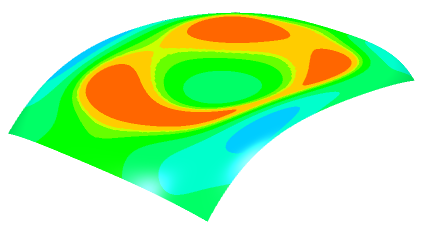
Adjust the color scale: In the Surfacic Curvature Analysis.x color scale dialog box, click Use Min Max.
- The maximum and minimum values in the dialog box are set according to the values detected on the surface.
- The analysis colors are updated to match the color scale in the dialog box.
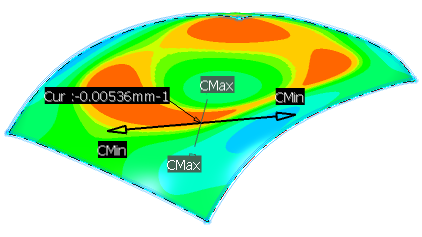
Show gaussian curvature information on all parts of the surface:
- In the Display Options area, select the On The Fly check box.
- Move the pointer over the surface.
At the position of the pointer, the following information is displayed:
- The local gaussian value of the curvature (Gaussian is selected in the Type area of the dialog box).
- The direction of the maximum curvature.
- The direction of the minimum curvature.
Show minimum/maximum/mean curvature information on all parts of the surface:
- In the Type area, select Minimum, Maximum or Mean.
- Move the pointer over the surface.
At the position of the pointer, the following information is displayed:
- The local minimum, maximum or mean value of the curvature (according to your selection in the dialog box).
- The local radius of curvature or mean radius of curvature (according to your selection in the dialog box).
- The direction of the maximum curvature.
- The direction of the minimum curvature.
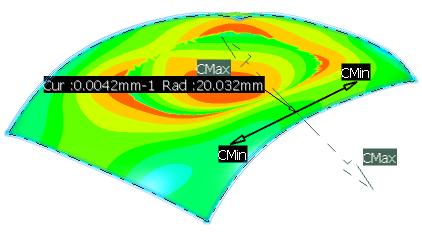
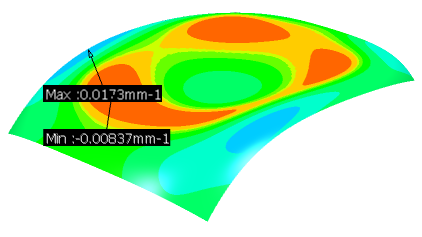
Show the position of the maximum and minimum values:
- In the Display Options area, clear the On The Fly check box.
- In the Display Options area, select the 3D MinMax check box.
The position and value of the maximum and minimum values is displayed.
Define a radius limit and reduce the number of colors in the color scale:
- In the Type area, select
Limited.
The Surfacic
Curvature Analysis.x dialog box
is modified; the color scale is reduced to four colors
and three values.
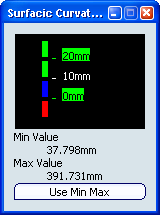
- In the Analysis Options area of the Surfacic curvature dialog box, type the value or use the arrows to change the radius value.
The values in the color scale dialog box are updated automatically.
Minimum curvature and radius values are displayed.
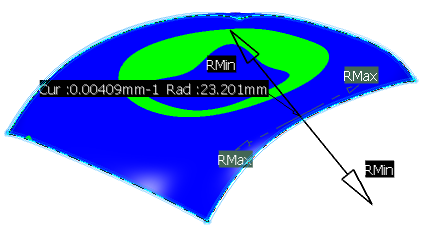
In the Type area, select
Inflection Area.
The Surfacic
Curvature Analysis.x dialog box
is modified; the color scale is reduced to three colors
and no values.
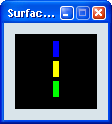
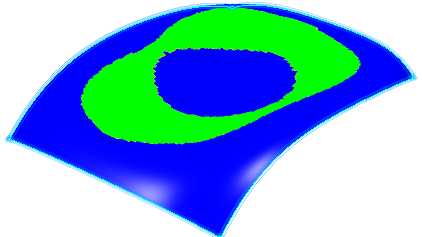
This analysis enables you to identify the curvature orientation:
- In green: the areas where the minimum and maximum curvatures
have opposite orientations.
- In blue: the areas where the minimum and maximum curvatures
have the same orientation.
Note:
Inflection lines created during Inflection Lines analysis are always created within the green area.
When you have finished working with this command, do one of the
following:
- To create the analysis, click OK.
The analysis is added to the specification tree where it is
identified as
Command_Name.Analysis.x.
The analysis will be updated automatically whenever you modify any of the elements in the analysis (for example when you deform an element using control points).
- To abandon the analysis, click
Cancel.