Data Readout Output | ||
| ||
Data Readout Dialog Box
The data readout function provides for a variety of data on a resources such as robots, NC machines, devices, mechanisms, and manikins to be displayed as you watch a simulation. This section describes the types of data available.
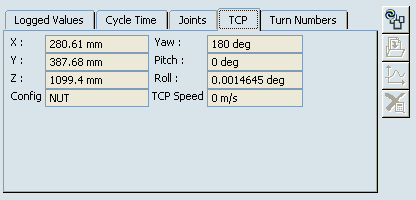
The actual content of the dialog box depends on the type of resource:
- Robot or NC machine: Cycle Time, Joints, TCP, Turn Numbers
- Device or mechanism: Cycle Time, Joints
- Manikin: Cycle time, Joints
![]()
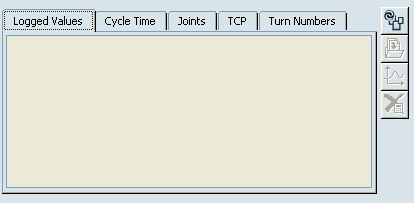
Logged Values
The top tab on the Data Readout dialog box is logged values.
The Logged Values tab shows general information about the simulation as it runs on the particular resource. The Logged Values are only updated if the Data Readout probe is active and if a simulation command is running. The Logged Values are not updated during direct manipulation of the corresponding resource (e.g. they will not be updated while running Jog command, even if the Data Readout probe is active).
![]()
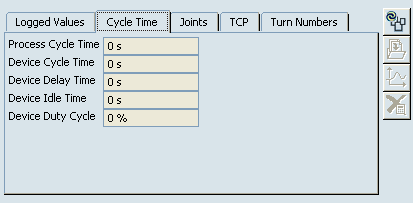
Cycle Time
The cycle times of all objects associated with the device's simulation appear.
The configuration of the robot is displayed, along with the Cycle Times appropriate to the device.
![]()
Joints
The joints and the extent to which they do or do not exceed their limits during the simulation are shown.
The joint values are displayed graphically as bars. The limits are also displayed on these graphical bars (e.g., -180 to 180 in Joint 1, below).
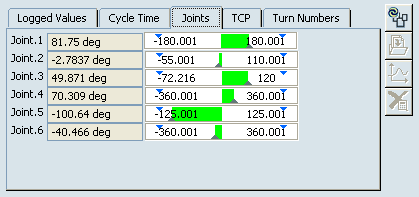
When a joint value exceeds a limit,
the bar becomes red and text in the bar shows by how much the limit has
been  exceeded (e.g., 107% in the example).
The joint values are displayed graphically as bars. The limits are also displayed on these graphical bars (e.g., -38.253 to 0 in Joint 1, below). When a device joint exceeds its limits, the graphic bar turns red. For a description of the appearance of the graphic bar, see Robot Data Readout Dialog Box: Joints Tab.