Plotting the Execution Result | |||||
|
| ||||
Plot Results
This scenario shows you how to plot two variables in a window, and how to plot the comparison between these two results.
These commands are available from the contextual menu of the Variable Browser.
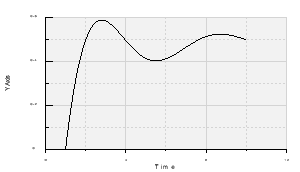
To plot the result in a new window, you can either:
- Select New Plotter.
- Double-click the variable.
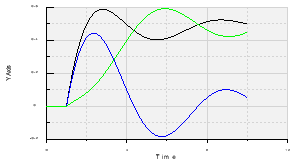
Right-click a second variable, then select Existing Plotter > Plotter1.
The second variable is added to the first plotter.
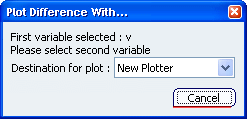
Right-click the same variable, then select Plot Difference With...
The Plot Difference With... dialog box appears, in which you can select a destination for your plot.
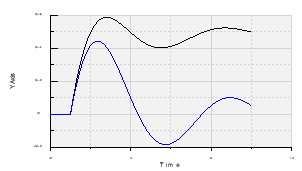
From the Variable Browser window, select the first variable.
The comparison between these two values is computed and added to Plotter 1.